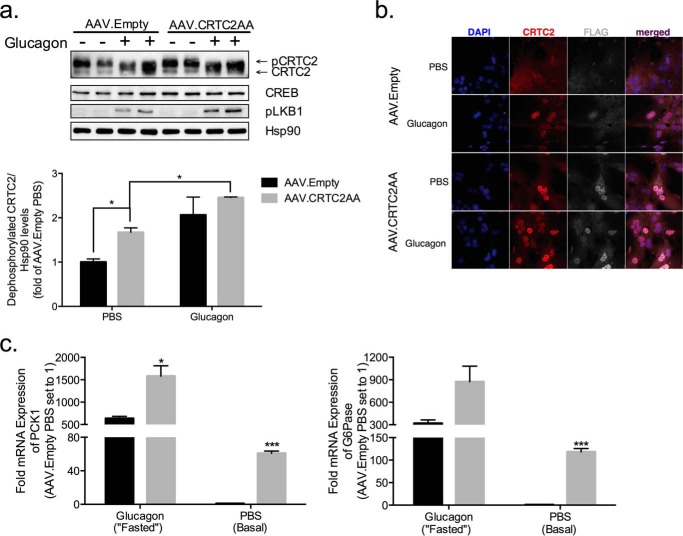
FIGURE 3.
Effect of phosphorylation-defective CRTC2 on gluconeogenic gene expression in isolated hepatocytes. a, immunoblot of hepatocytes isolated from mice infected with AAV.Empty or AAV.CRTC2AA viruses. Cells were exposed to glucagon (100 nm) or PBS for 1 h. Amounts of dephosphorylated CRTC2 quantified below. (*, p < 0.05; data shown as mean ± S.E.) b, immunofluorescence images of hepatocytes isolated from mice infected with AAV.Empty or AAV.CRTC2AA (as in a). c, effect of glucagon or PBS (1 h) on gluconeogenic gene expression in hepatocytes isolated from mice previously infected with AAV. Empty or AAV.CRTC2AA. All expression values are normalized to L32 and then expressed as fold change where hepatocytes from AAV. Empty mice treated with PBS are set to 1, n = 3. (*, p < 0.05; ***, p < 0.0005 compared with AAV. Empty of same treatment; data shown as mean ± S.E.)

