FIGURE 4.
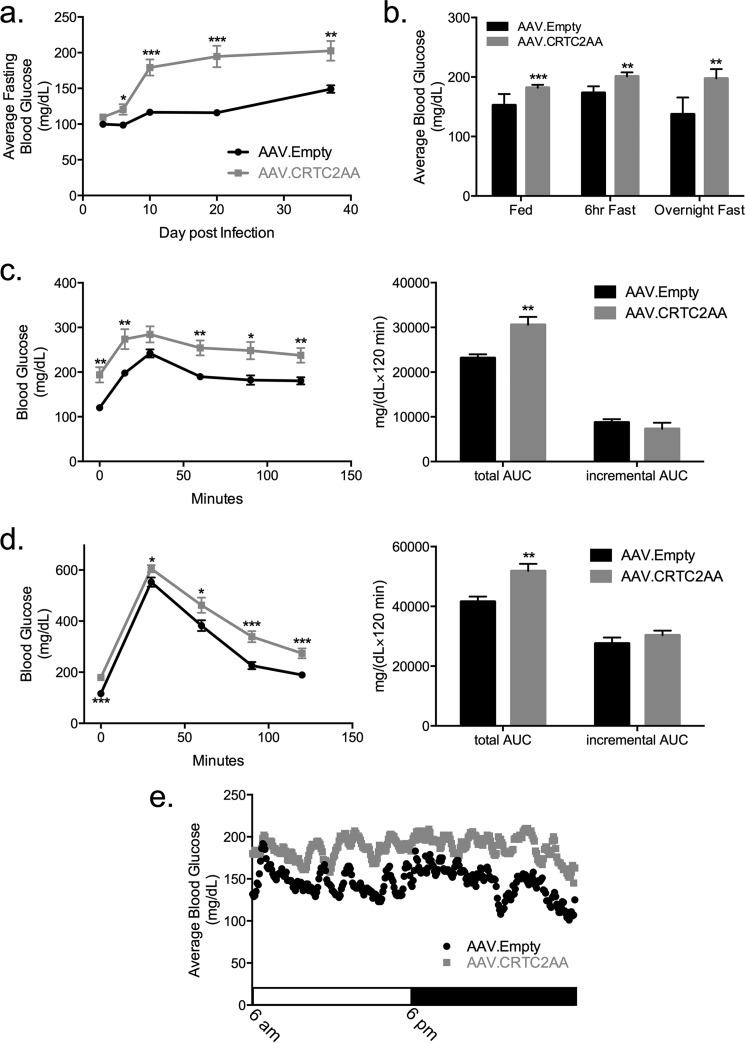
Chronic activation of the CREB pathway in liver increases fasting blood glucose concentrations. a, average overnight fasting blood glucose levels of mice infected with AAV.Empty or AAV.CRTC2AA over a 37-day period, n = 10. b, average blood glucose levels during ad-lib and fasting conditions; day 17–30, n = 10–20. c, pyruvate tolerance test on day 20 post virus injection, 2 g sodium pyruvate/kg mouse, n = 7. Right hand side of the figure shows calculated total area under the curve and incremental area under the curve. d, intraperitoneal glucose tolerance test on day 10 following viral infection, 1 g glucose/kg mouse, n = 10. Right, calculated total and incremental area under the curve. e, continuous glucose monitoring over a 24 h light/dark cycle with free access to food and water; n = 2 per group, 2 days of monitoring; average values shown. (*, p < 0.05; **, p < 0.005; ***, p < 0.0005 compared with AAV.Empty mice; data shown as mean ± S.E.).

