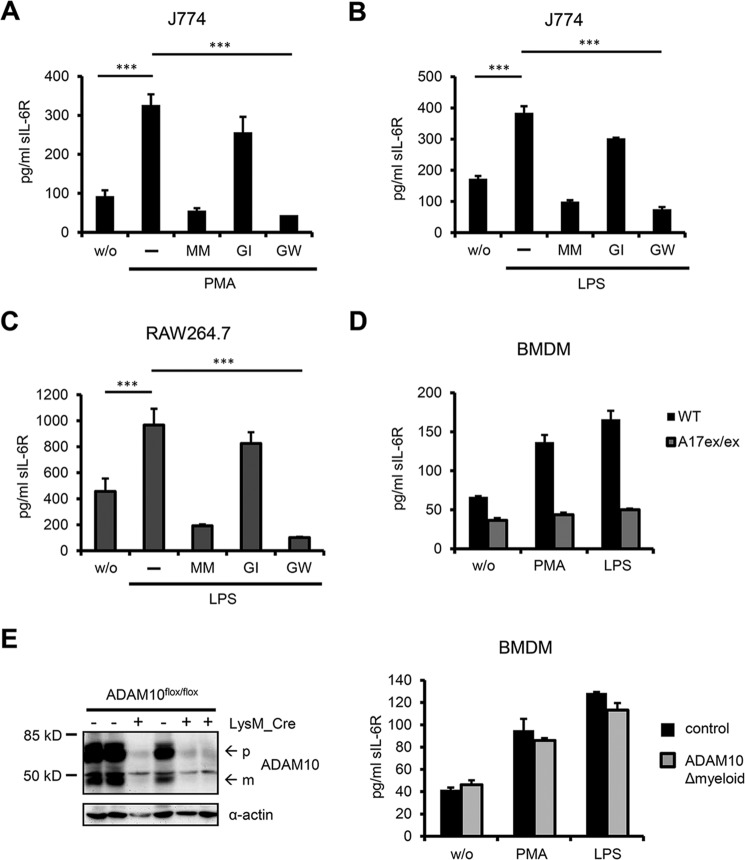
FIGURE 2.
A, murine J774 cells were treated for 1 h with 100 nm PMA. Inhibitors Marimastat (MM, 3 μm), GI (3 μm), and GW (3 μm) were added 30 min prior to stimulation and sIL-6R was measured by ELISA. B, J774 cells were stimulated for 2 h with 1 μg/ml of LPS with or without inhibitors (3 μm). sIL-6R levels in conditioned supernatant were determined by ELISA. C, murine RAW 264.7 cells were treated as in B and conditioned supernatants were assessed for sIL-6R levels by ELISA. D, BMDMs from ADAM17ex/ex and wild type mice were treated with 100 nm PMA or 1 μg/ml of LPS for 2 h. sIL-6R was quantified by ELISA. Data from one ADAM17ex/ex mouse and corresponding wild type littermate are shown representatively (n = 3 mice). Error bars represent S.D., n = 2 independent experiments. E, left: ADAM10 expression in BMDMs from ADAM10flox/flox mice ± LysM_Cre was visualized by Western blotting. ADAM10flox/flox mice transgenic for LysM_Cre will be designated as ADAM10Δmyeloid mice hereafter, whereas ADAM10flox/flox littermates will serve as corresponding control mice. Pro- and mature form of ADAM10 are designated with p and m, respectively. 3 mice per genotype are shown. α-Actin expression serves as loading control. Right, BMDMs from ADAM10Δmyeloid and control mice (n = 2 mice per group) were treated as in D and sIL-6R was measured by ELISA. Results from one corresponding mouse pair are shown. Error bars are S.D., n = 2 independent experiments. A–C, error bars represent S.D. of 3 independent experiments. ***, p < 0.001.

