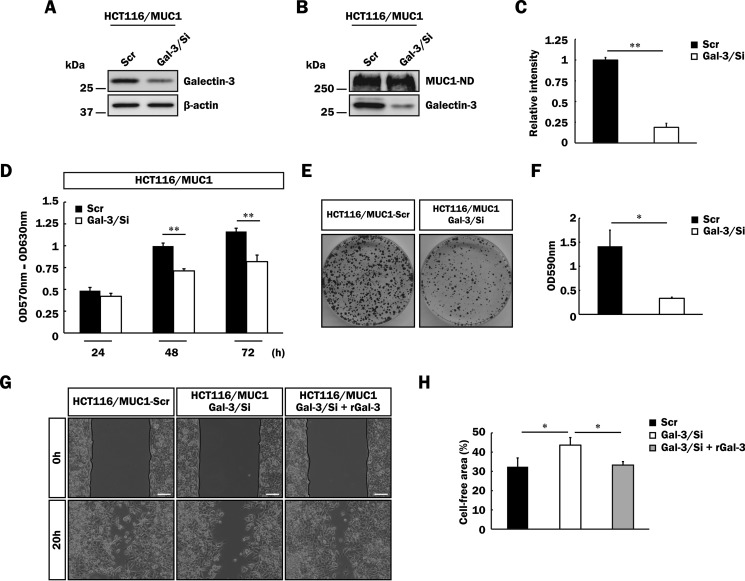
FIGURE 10.
Effect of galectin-3 silencing on malignancy of MUC1-expressing cells. A, lysates of HCT116/MUC1-Scr and HCT116/MUC1-Gal-3/Si cells were subjected to SDS-PAGE, followed by Western blotting as described in Fig. 1C. β-Actin was used as a loading control. B, biotin-labeled MUC1-ND and galectin-3 on the surface of HCT116/MUC1-Scr and HCT116/MUC1-Gal-3/Si cells were detected as described in Fig. 2A. C, the level of galectin-3 on the cell surface was determined by measuring the intensities of the bands in Fig. 10B as described in Fig. 2B (means ± S.D., n = 3). **, p < 0.01. D, HCT116/MUC1-Scr and HCT116/MUC1-Gal-3/Si cells (1 × 10⁴ cells) were plated, and the proliferation level was determined as described in Fig. 8 (A–C) (means ± S.D., n = 3). **, p < 0.01. E and F, HCT116/MUC1-Scr and HCT116/MUC1-Gal-3/Si cells (5 × 10³ cells) were plated, and then anchorage-dependent cell proliferation was evaluated by measuring the absorbance as described in Fig. 8 (D and E) (means ± S.D., n = 3). *, p < 0.05. G and H, HCT116/MUC1-Scr and HCT116/MUC1-Gal-3/Si cells were precultured using culture inserts. After creating a gap, the cells were further incubated for 20 h under the same conditions as described in Fig. 9 (A and B). HCT116/MUC1-Gal-3/Si cells were also cultured in the presence of recombinant galectin-3 (rGal-3) (40 μg/ml), and their cell motilities were assessed as described above. The percentage of the cell-free area was calculated as described in Fig. 9 (C and D) (means ± S.D., n = 3). *, p < 0.05. Image magnification is ×100. Scale bars, 100 μm.

