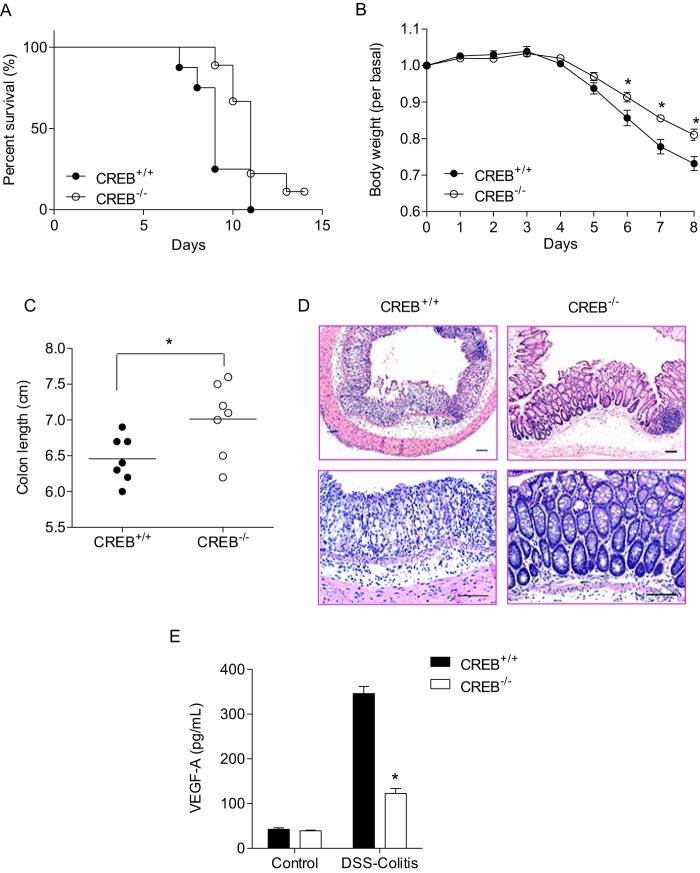
FIGURE 7.
DSS-induced colitis is reduced in CREB−/− mice compared with littermate control CREB+/+ mice. A, difference in the survival is shown by the Kaplan-Meier plot. The log-rank test indicates significant survival differences between CREB+/+ and CREB−/− mice (n = 8–9 mice per genotype, p < 0.05). B, body weight data are mean ± S.E. (n = 8–9 mice per genotype; *, p < 0.05). C, difference in colon length is shown (n = 7 mice per genotype; *, p < 0.05). D, representative images of H&E-stained intestinal sections. Scale bar, 100 μm. E, mouse VEGF-A ELISA is performed in CREB+/+ and CREB−/− mice. Data are mean ± S.E. (n = 4–5 mice per genotype; *, p < 0.05).

