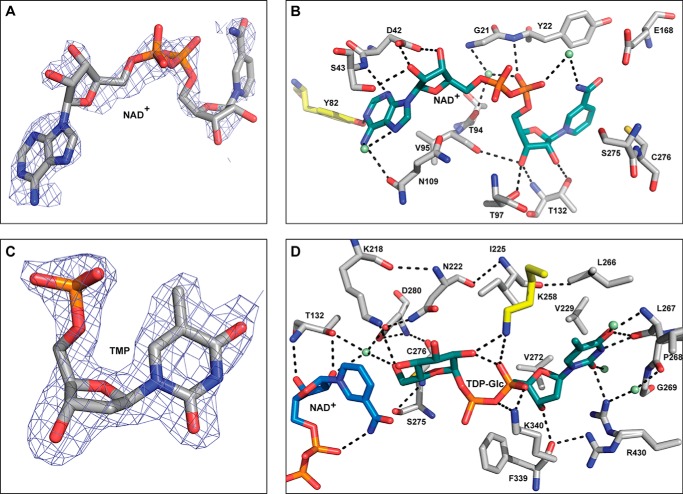
FIGURE 3.
CalS8 (PDB 4XR9) active site interactions. A, electron density map of NAD+ within CalS8 structure (PDB 4XR9; NAD+ occupancy is 0.9). B, residues involved in cofactor binding where the putative regulatory tyrosine is highlighted in yellow and water molecules are represented as green spheres. C, 2mFo-DFc electron density map contoured at 1σ of TMP within CalS8 structure (PDB 4XR9; TMP occupancy is 0.9). D, residues involved in binding the sugar-α-1-phosphate portion of the substrate highlighting key residues involved in catalysis. Water molecules are represented as green spheres, and lysine from the adjacent subunit is colored yellow.

