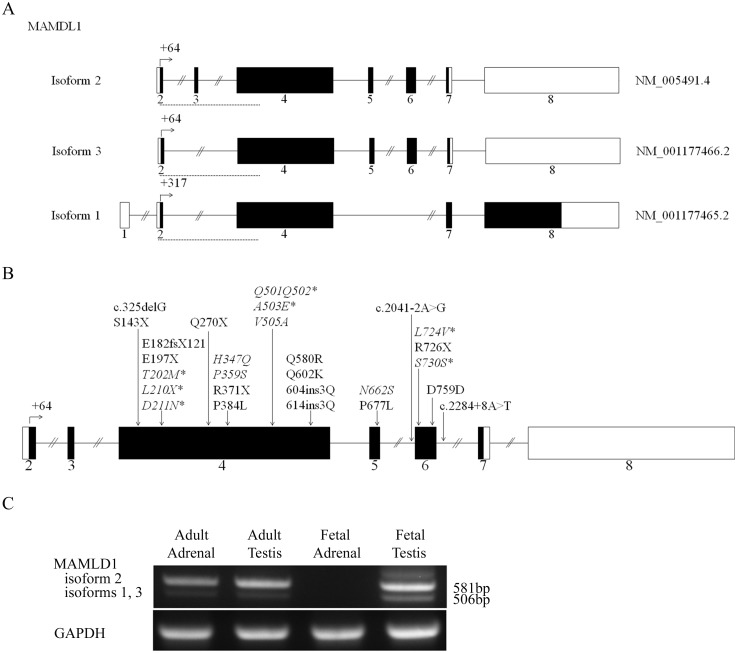
Fig 1. MAMLD1 transcripts, reported mutations and tissue expression.
A. Schemes of the 3 MAMLD1 human transcripts are shown (http://www.ncbi.nlm.nih.gov/; http://www.ensembl.org). B. Scheme showing all reported MAMLD1 gene mutations. Mutations described in this study are shown in red and the novel ones are marked with an asterisk. C. Assessment of MAMLD1 expression in human fetal and adult adrenal and testis. Semiquantitative RT-PCRs were performed using specific primers (S1 Table). GAPDH was used as the internal control. A representative gel picture is shown (n = 3). For MAMLD1 the band at 581 bp corresponds to isoform 2 and the band at 506 bp to isoforms 1 and 3. Dashed red lines in A indicate the location of the PCR fragments amplified for the expression studies.

