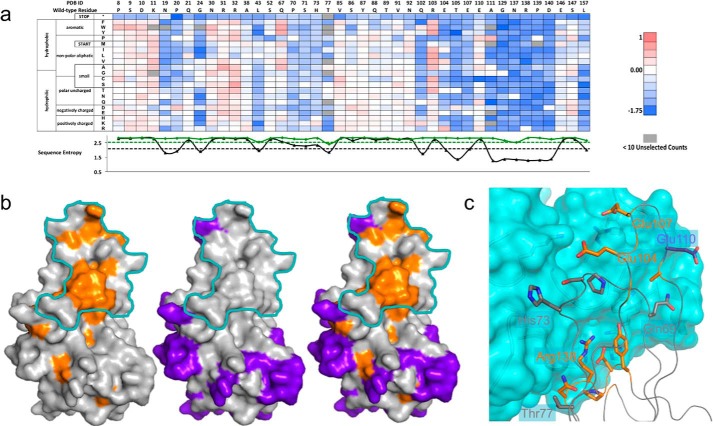
FIGURE 2.
TNF-infliximab conformational epitope determination. a, a subset (41/177 residues) of the fitness-metric heat map for bound population of the TNF-inflix_scFv interaction. Sequence entropy for the display (green) and bound population (black) is plotted below with their respective cut-offs (dashed lines). b, subtractive sequence entropy analysis for TNF-infliximab interaction. Conserved residues (orange) are found mainly within the binding footprint of the TNF-infliximab interaction (cyan). Non-conserved residues (purple) can also be mapped onto structure and fall outside of the footprint (middle). These non-conserved residues can be used to find regions where false positive conserved residues appear. For clarity, only one TNF monomer is shown. c, close-up view of the structural interface between TNF (ribbon) and infliximab (cyan surface). TNF residues are colored according to sequence conservation as in panel b.

