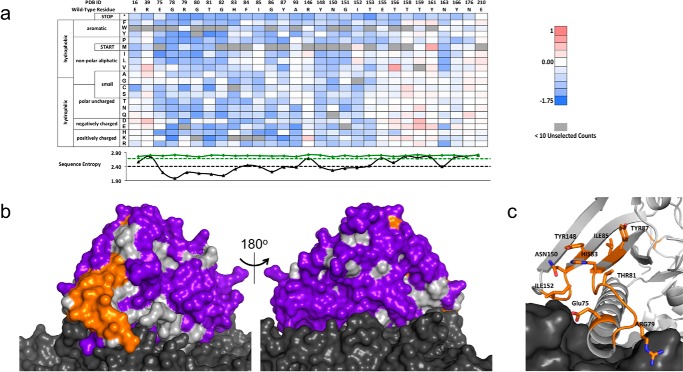
FIGURE 4.
PTxS1 conformational epitope determination. a, a subset (29/220 residues) of the fitness-metric heat map for the PTxS1-hu1B7 interaction. Sequence entropy for the unselected/display population (green) and unselected/bound population (black) is plotted below with their respective cut-offs (dashed lines). b, subtractive sequence entropy analysis for PTxS1-hu1B7interaction. The light gray surface represents the S1 subunit, and the dark gray represents other subunits of PTx. Conserved residues (orange) are found on the S1 subunit proximal to the S5 and S6 subunits. Non-conserved residues (purple) are found over most of the solvent-accessible surface area. c, close-up view of the conserved residues at the epitope interface. PTxS1 is represented with a schematic and sticks format, whereas the other subunits are represented as the dark gray surface.

