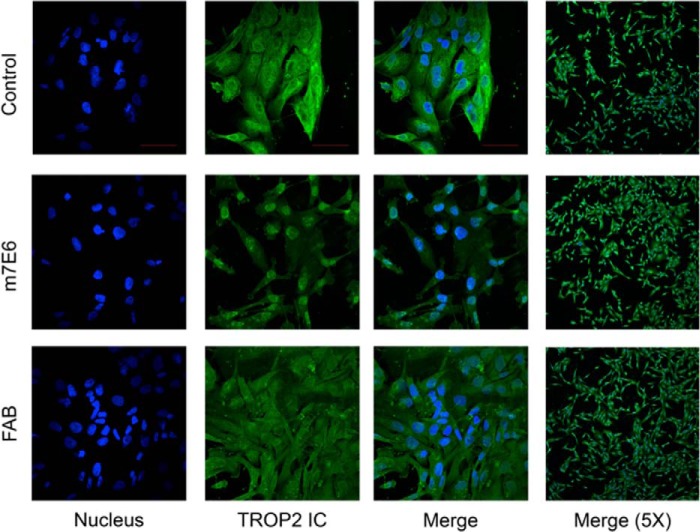
FIGURE 9.
Confocal images showing expression and localization of TROP2 intracellular domain represented by green fluorescence in MDA-MB-231 cells treated with PBS (control), m7E6 IgG, or Fab with nuclear counter-staining indicated by blue fluorescence. The individual panels were recorded at 60× magnification (scale bar = 50 μm) with identical image acquisition parameters between different conditions.

