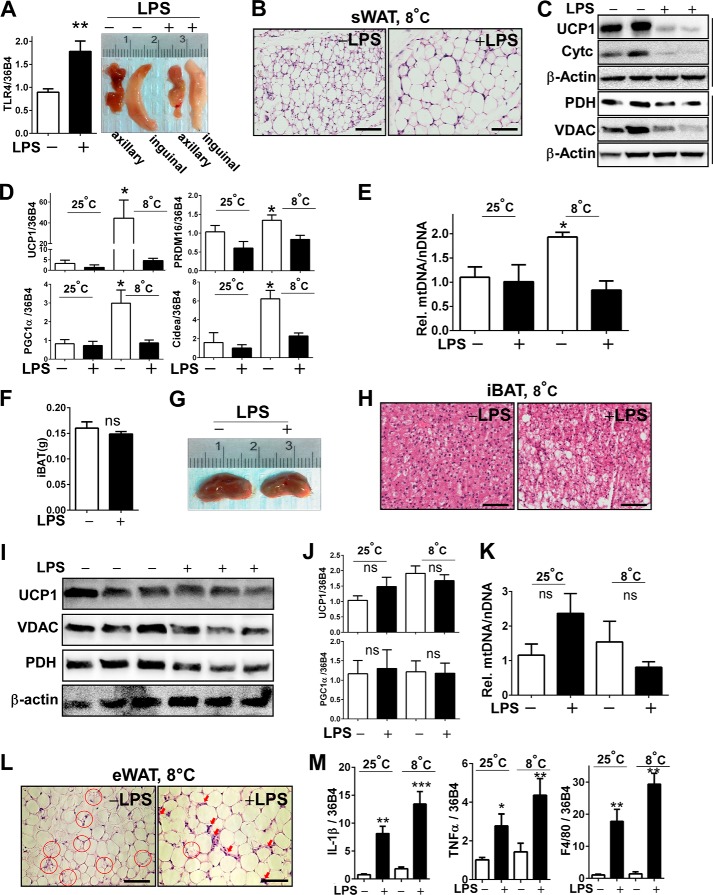
FIGURE 3.
LPS administration inhibited cold acclimation-induced WAT browning and mitochondrial biogenesis. C57BL/6 mice received either saline or LPS injection every other day for 2 weeks at 8 ºC. A, TLR4 mRNA expression by qPCR (left) and gross images of axillary and inguinal adipose tissue after cold acclimation (right). B, representative microscopic images of sWAT revealed by H&E staining (scale bar = 100 μm). C, immunoblot analysis of sWAT for UCP1, VDAC, PDH, and cytochrome c (Cytc). D, relative gene expression levels of brown-specific markers of UCP1, PRDM16, PGC1α, and CIDEA in sWAT measured by qPCR. E, relative mtDNA contents normalized by nuclear DNA in sWAT. F, tissue mass of iBAT. ns, not significant. G, representative gross image of iBAT after cold acclimation. H, representative microscopic images of iBAT revealed by H&E staining (scale bar = 100 μm). I, immunoblot analysis of iBAT for UCP1, VDAC, and PDH. J, relative gene expression levels of UCP1 and PGC1α in iBAT by qPCR. K, relative mtDNA contents in iBAT. L, representative microscopic image of epididymal WAT (eWAT) after cold acclimation. Adipocytes undergoing lipolysis are marked in red circles. Macrophage infiltration is marked in red arrows (scale bar = 100 μm). M, relative gene expression of IL-1β, TNFα, and F4/80 in epididymal WAT. All data are presented as the mean ± S.E. *, p < 0.05; **, p < 0.01; ***, p < 0.001 by Student's t test.

