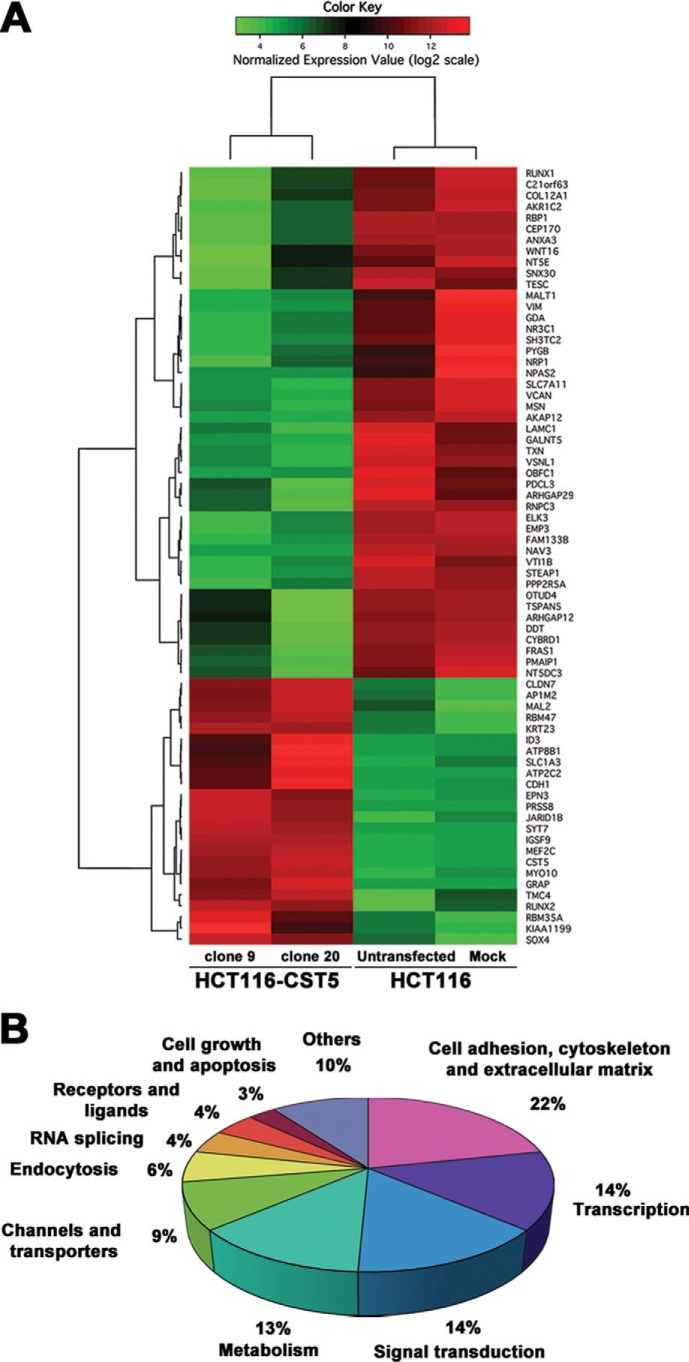
FIGURE 6.
Cystatin D modulates gene expression in HCT116 cells. A, heat map representation of significantly modulated genes by cystatin D: 23 up-regulated genes and 46 down-regulated genes. B, functional distribution of candidate target genes regulated by cystatin D overexpression. The most represented categories and the percentage of genes in them are shown.

