FIGURE 7.
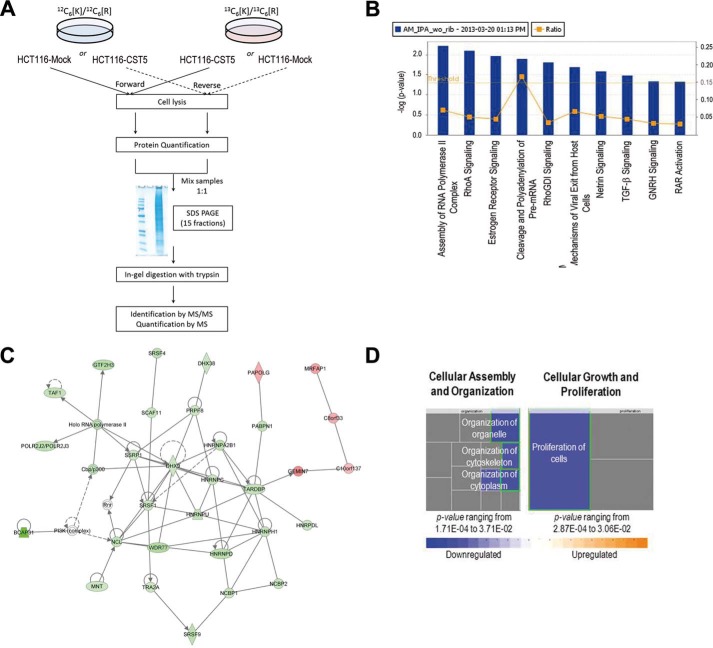
Effect of cystatin D on the nuclear proteome of HCT116 cells. A, scheme of the workflow followed in the quantitative proteomics analysis. B, canonical pathways most affected by the expression of cystatin D in HTC116 cells. Yellow dots represent the ratio of the number of molecules quantified in the SILAC analysis in the pathway relative to the total number of molecules in the pathway. Yellow line represents the threshold value from which data are statistically significant. Nine of the most significantly affected pathways are shown. C, RNA post-transcription modification, RNA damage and repair associated network function. This network, identified with a score of 58, shows the multiple interactions between the differentially expressed proteins due to the presence of cystatin D and proteins in IPA database. Thirty-one proteins (26 up-regulated and 5 down-regulated) of a total of 292 were used to build this network. Holo-RNA polymerase II, CBP-p300/CREBBP-EP300, PI3K (complex), and Rnr were added to complete the network. D, molecular and cellular functions were affected by cystatin D expression. Cellular assembly and organization is one of the functions most affected (p value ranging from 1.71E-04 to 3.71E-02); proliferation of cells (p value 2.87E-04; z-score: −2.102 (decreased)), function related to cell growth and proliferation was also highly affected.

