FIGURE 9.
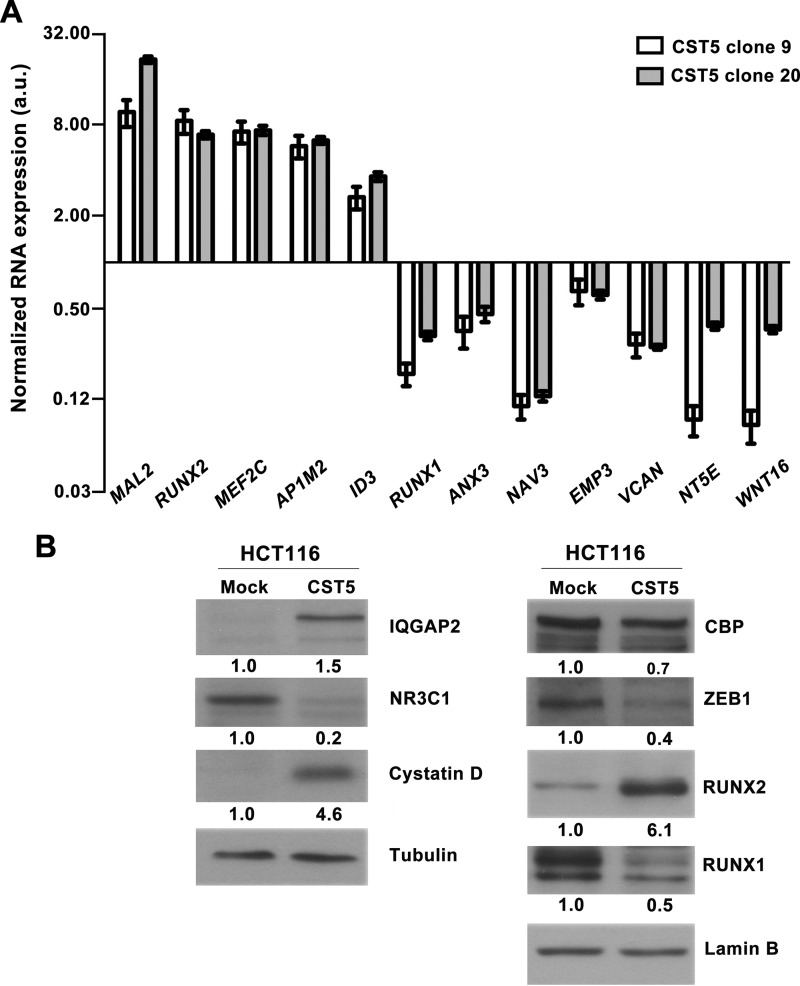
Validation of cystatin D targets. A, qRT-PCR analysis of the expression level of several RNAs identified as candidate targets of cystatin D in the transcriptomic study. Expression levels in two clones (9 and 20) of HCT116-CST5 cells were normalized versus those in HCT116-Mock cells. Data are presented as mean ± S.E. of at least two independent experiments. B, Western blot analysis (20 μg of total cell extracts) of the expression in HCT116-CST5 and HCT116-Mock cells of several proteins selected from the transcriptomic or proteomic analyses. Cystatin D and loading controls (lamin B, β-tubulin) are also shown.

