
FIGURE 2.
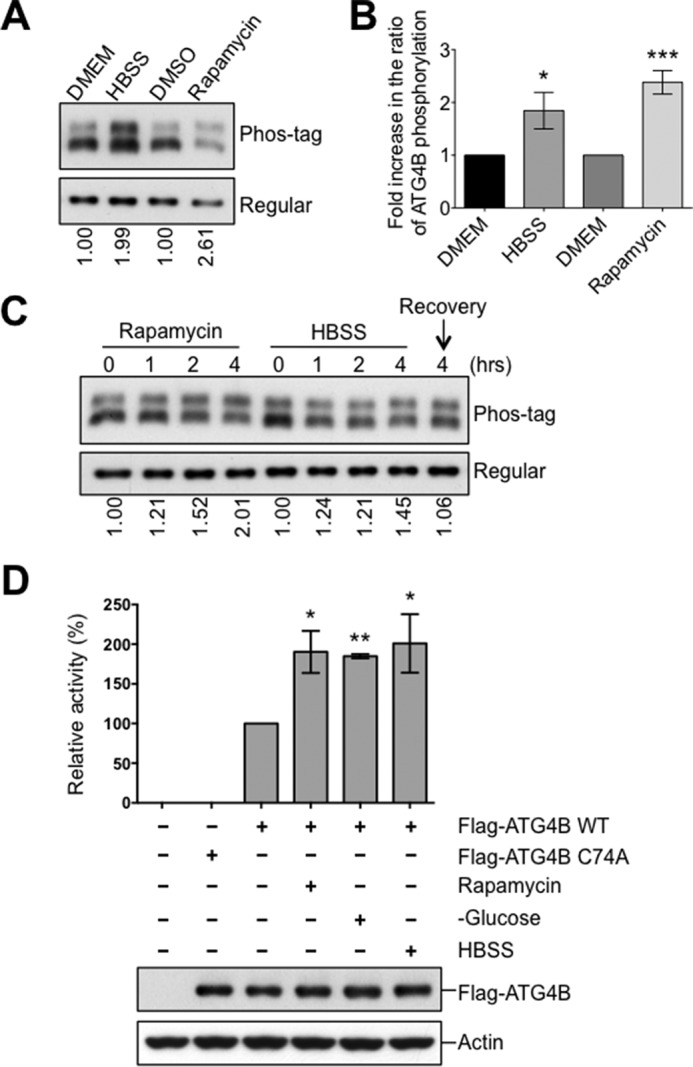
Increase of ATG4B phosphorylation and protease activity upon the induction of autophagy. A–C, HEK293T cells expressing Flag-ATG4B WT were cultured with or without rapamycin (25 μg/ml) or HBSS starvation for 4 h. In C, after 4 h HBSS starvation, cells were recovered by introducing nutrient medium (DMEM) for 4 h. Cell lysates were subjected directly to phos-tag versus regular SDS-PAGE and then analyzed by immunoblotting using anti-ATG4B antibody. The fold increase in the ratio of phosphorylated/non-phosphorylated ATG4B relative to the DMEM condition (or time 0) was quantified using scanning densitometry (values shown below lanes and plotted in B, *, p < 0.05; ***, p < 0.001). D, HeLa cells expressing Flag-tagged empty vector or Flag-ATG4B WT or C74A mutant proteins were cultured under various nutrient conditions for 5 h. Immunoprecipitated Flag-ATG4B was analyzed by immunoblotting with anti-ATG4B and anti-Actin antibodies. Protease activity of immunoprecipitated ATG4B was measured by LC3-PLA2 assay over time (0–80 min). ATG4B activity at 30 min was within the linear phase of the reaction and was further normalized relative to ATG4B WT from nutrient-rich conditions (set as 100%; mean ± S.D.; n = 3; *, p < 0.05; **, p < 0.01).