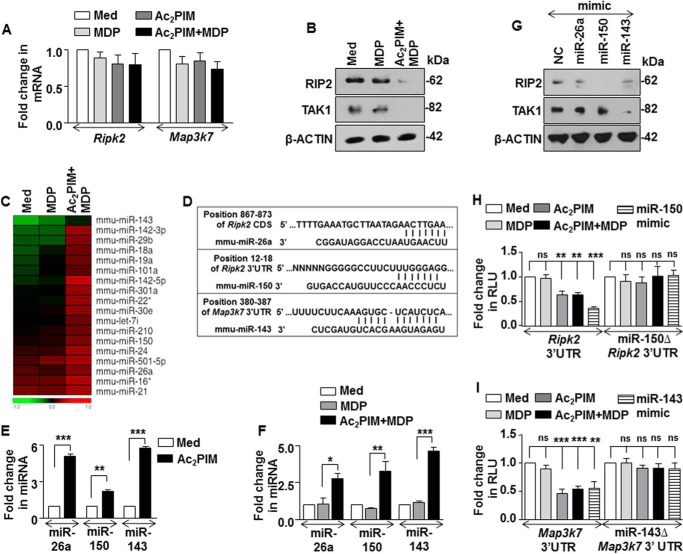
FIGURE 2.
miR-150 and miR-143 target RIP2 and TAK1 kinases. A and B, peritoneal macrophages were pretreated with Ac2PIM followed by MDP treatment for 2 h. Transcript (A) and protein (B) levels of RIP2 and TAK1 were determined by Real-Time qRT-PCR and immunoblotting respectively. C, genome-wide miRNA microarray profiling was done in macrophages treated as indicated. A heat map comparison of miRNAs that exhibited increased fold expression in the Ac2PIM-MDP co-treated samples when compared with MDP alone (n = 2). D, putative miR-26a, miR-150 and miR-143 binding sites in the CDS of Ripk2, 3′-UTR of Ripk2 and 3′-UTR of Map3k7, respectively. E and F, peritoneal macrophages were treated with Ac2PIM alone for 4 h (E) or with Ac2PIM for 2 h prior to 2 h MDP treatment (F). Real-Time qRT-PCR was performed on total RNA isolated using miRNA-specific primers. G, RAW 264.7 macrophages were transfected with specific miRNA mimics as indicated to assess the total expression levels of RIP2 and TAK1 by immunoblotting. H and I, RAW 264.7 macrophages were transfected with WT Ripk2 3′-UTR or miR-150Δ Ripk2 3′-UTR (H) or WT Map3k7 3′-UTR or miR-143Δ Map3k7 3′UTR (I) with miR-150 mimics (H) or miR-143 mimics (I) as indicated. Transfected macrophages were further treated with MDP or Ac2PIM or both and luciferase assay was performed. All data represent the mean ± S.E. from three independent experiments, *, p < 0.05; **, p < 0.005; ***, p < 0.001; ns, non-significant (t test in E, one-way ANOVA in F, H, and I). All blots are representative of three independent experiments. The cells were treated with 2 μg/ml Ac2PIM for 2 h unless mentioned otherwise followed by 200 ng/ml MDP. Med, medium; NC, negative control.

