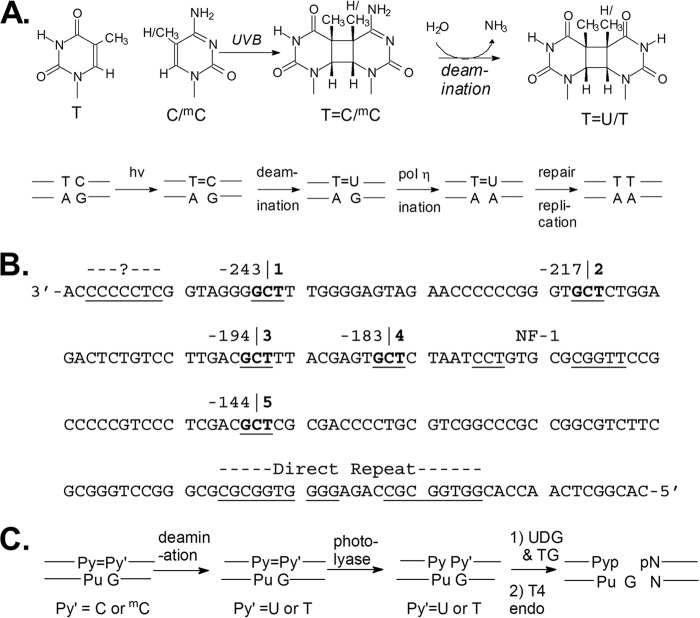
FIGURE 1.
Photobiology of TC CPDs and their detection in FOS DNA. A, formation and deamination of methylated and unmethylated TC CPDs that result in C to T mutations. B, the bottom strand of the FOS promoter with the five TCG sites underlined in boldface type and their position given relative to the transcription start site. Various known and unknown protein binding sites are also underlined. C, enzymatic steps used in the LMPCR assay to determine the deamination rates of TC CPDs.

