
FIGURE 2.
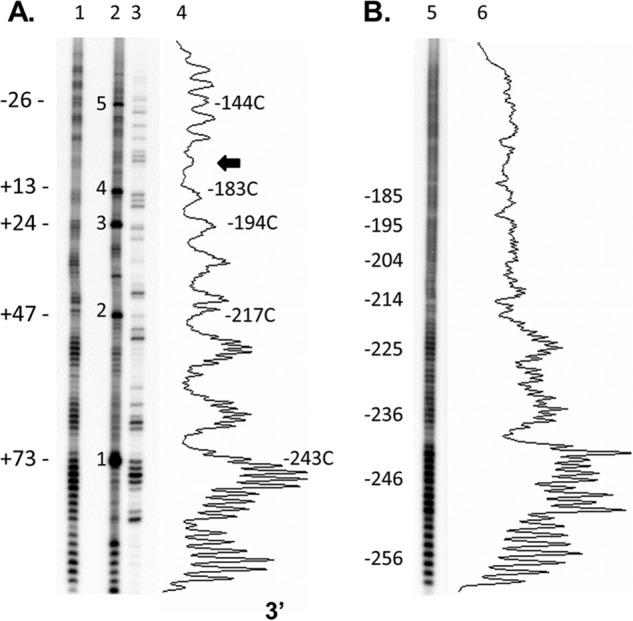
In vivo and in vitro hydroxyl radical footprints downstream of −253 in the FOS promoter. A, in vivo. Lane 1, hydroxyl radical footprint with the numbers to the left referring to proposed positions of the TCG CPDs relative to the nucleosome dyad; lane 2, 48-h deamination reaction with the numbers to the left referring to the TCG CPD sites numbered according to Fig. 1; lane 3, Maxam-Gilbert G reaction; lane 4, densitometry trace of lane 1, with numbers to the right indicating the position of a peak relative to the transcription start site. The arrow indicates the proposed location of the dyad axis. B, in vitro. Lane 5, hydroxyl radical footprint; lane 6, densitometry trace of lane 5.