
FIGURE 3.
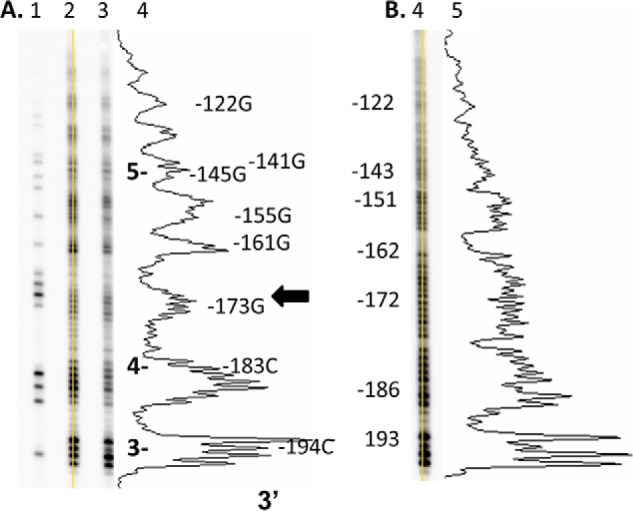
In vivo and in vitro hydroxyl radical footprints upstream of −190 of the FOS promoter. A, lane 1, Maxam-Gilbert G reaction conducted on genomic DNA in vitro; lanes 2 and 3, hydroxyl radical footprinting reactions carried out at two different reagent concentrations in vivo; lane 4, densitometry trace of lane 2, with numbers to the right indicating the position of a peak relative to the transcription start site and the arrow indicating the proposed location of the dyad axis. B, lane 5, hydroxyl radical footprint carried out on genomic DNA in vitro; lane 6, densitometry trace of lane 5.