
FIGURE 8.
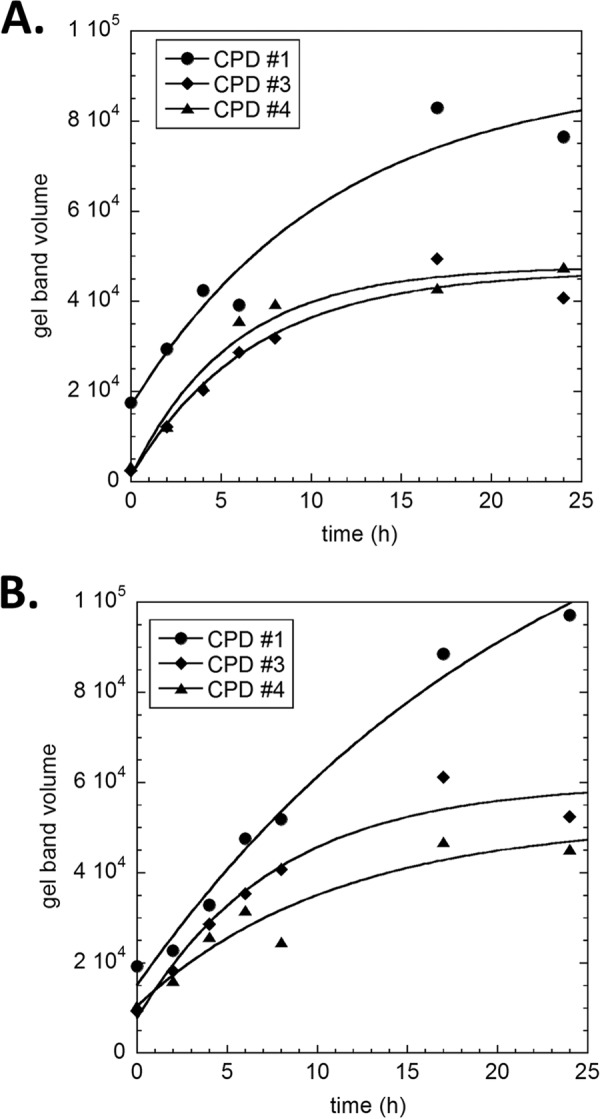
Curve fit plots of the in vivo deamination of the TCG CPDs from in vivo irradiated DNA as a function of deamination time. A, raw band volumes from the phosphor image shown in Fig. 7 are plotted against deamination time and fit to a first order process as described under “Experimental Procedures.” B, repeat of the experiment.