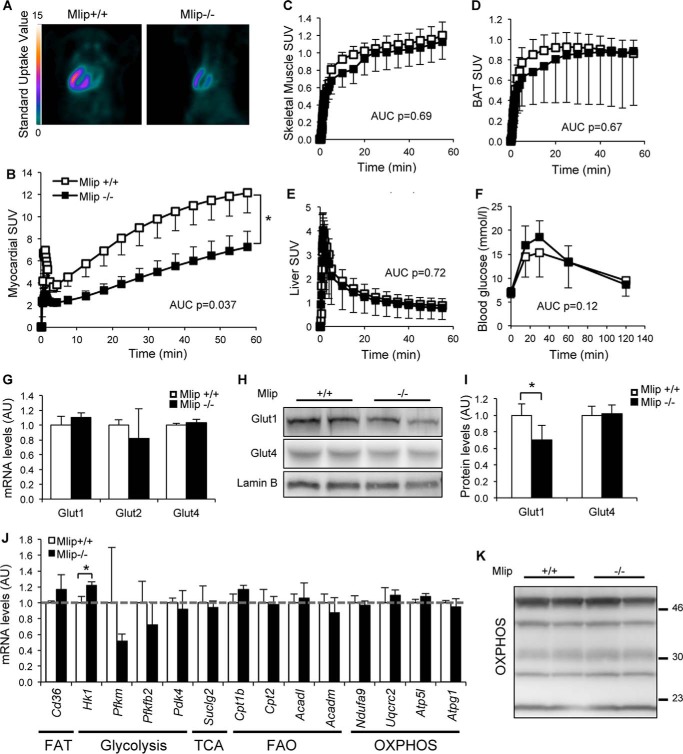
FIGURE 4.
Glucose uptake is altered in Mlip-deficient hearts. A, myocardial FDG uptake in 12-week-old Mlip+/+ and Mlip−/− male hearts detected by positron emission tomography imaging. B–E, quantification of the FDG uptake over time in the myocardium (B), skeletal muscle (Quadriceps, C), brown adipose tissue (BAT, D), and liver (E) (n = 6–7 per genotype, means ± S.E.). AUC, area under the curve. Student's t test was used. F, glucose tolerance test in 20-week-old Mlip+/+ and Mlip−/− male mice (n = 8 per genotype, means ± S.D.). Student's t test was used. G, cardiac Glut1, Glut2, and Glut4 mRNA levels in 12-week-old Mlip+/+ and Mlip−/− male mice (n = 3 per genotype, means ± S.D.). H and I, cardiac Glut1 and Glut4 protein levels in 12-week-old Mlip+/+ and Mlip−/− male hearts (n = 4 per genotype, means ± S.D.). *, p < 0.05. Student's t test was used. Lamin B was the loading control. J, cardiac mRNA levels of key genes involved in fatty acid transport (FAT), glycolysis, TCA cycle, fatty acid oxidation (FAO), and oxidative phosphorylation (OXPHOS) in the heart of 12-week-old Mlip+/+ and Mlip−/− male mice (n = 3 per genotype, means ± S.D.). *, p < 0.05. Student's t test was used. K, Western blot of the five mitochondrial oxidative phosphorylation complexes in 12-week-old Mlip+/+ and Mlip−/− male hearts.

