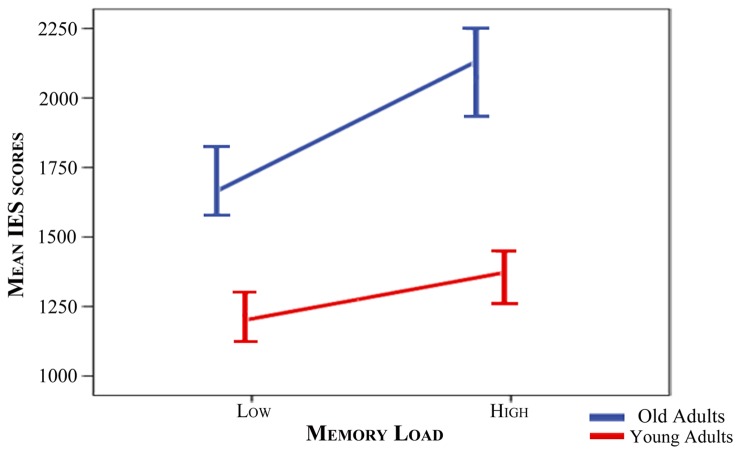
Fig 2. Increase in IE scores from low to high memory load conditions for each group.
Segments depicting the slope of the increase in mean IE scores from the low load memory condition to the high load memory condition for each group (blue: old adults, red: young adults). Bars at the segment’s edges indicate standard errors (multiplied by 2).

