FIGURE 4.
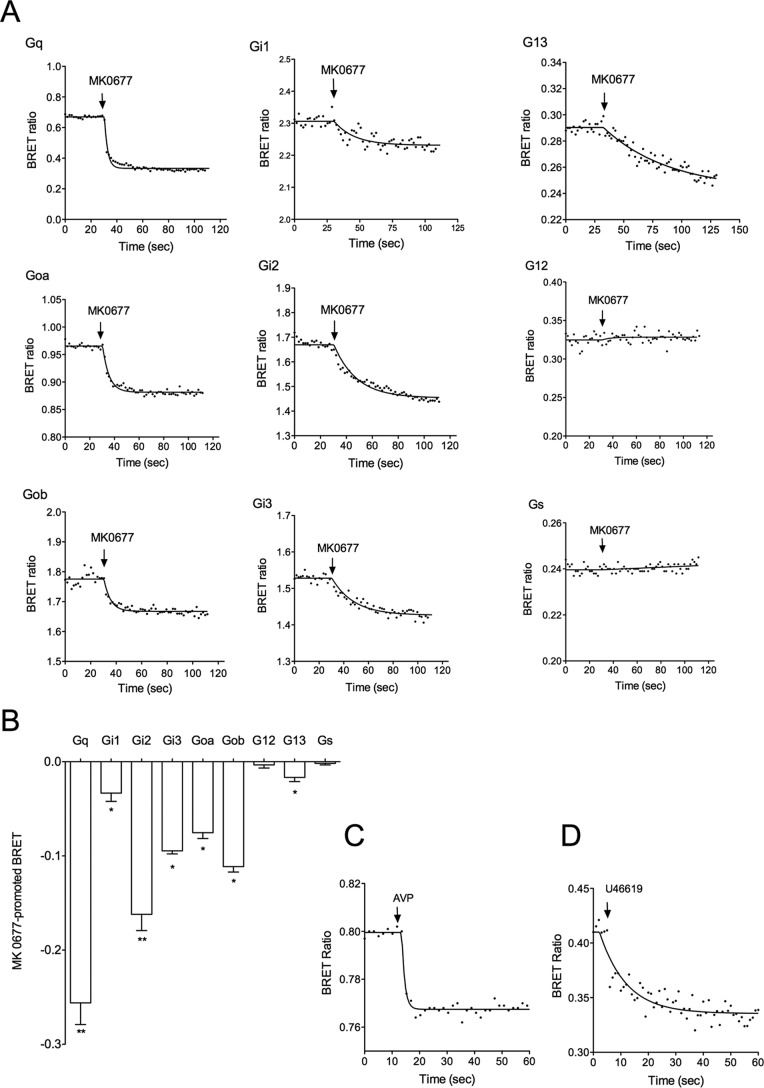
Activation of G protein subtypes and isoforms by GHS-R1a. A, G protein activation kinetics was measured by BRET2 using G protein activation biosensors as described under “Experimental Procedures.” HEK293T cells co-expressing both the GHS-R1a and the G protein biosensor were stimulated by the GHS-R1a agonist MK-0677 (10−6 m). Data are representative of three to eight independent experiments. B, BRET maximal signal promoted by 10−6 m MK-0677 on HEK293T cells co-expressing GHS-R1a and G protein biosensors. Results are expressed as the difference in BRET ratio measured in the presence and in the absence of ligand stimulation for each G protein type (mean ± S.E.). Statistical significance between stimulated and non-stimulated cells was assessed using a paired Student's t test (**, p < 0.01; *, p < 0.05). C, Gs activation by the vasopressin V2 receptor. HEK293T cells co-expressing the V2 vasopressin receptor and Gs biosensor were stimulated by 10−6 m Arg-vasopressin, and the BRET signal was recorded as described in A. D, G12 activation by the thromboxane A2 α type (TPα) receptor: HEK293T cells co-expressing the TPα receptor and G12 biosensor were stimulated by 10−6 m U46619, and the BRET signal was recorded at described in A.

