FIGURE 1.
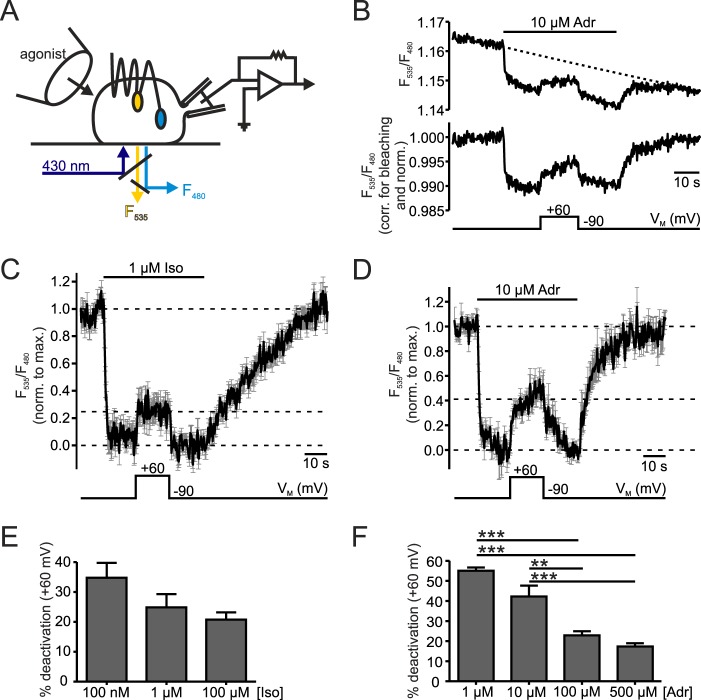
Depolarization reduced β1-AR activation. A, schematic of FRET and electrophysiology measurements illustrated with a cell expressing a β1-AR sensor. Cells were excited at 430 nm (dark blue) and donor (F480, light blue) and acceptor (F535, yellow) emissions were recorded. Simultaneously, cells were superfused with buffer or agonist-containing buffer with a pressurized perfusion system (left), and the membrane potential was controlled in whole-cell voltage-clamp configuration (patch pipette and amplifier, right). B, representative measurement of the transiently transfected β1-AR sensor stimulated with 10 μm Adr. The FRET ratio (F535/F480) is shown before (above) and after (below) correction for photobleaching by subtraction of a mono-exponential curve (τ = 574 s) and normalization to the initial FRET value before stimulation. A black bar with agonist labeling above the ratio trace indicates the duration of application and type of agonist used. The time scale appears as a black bar in every graph. The bar below the traces shows the course of membrane potential (holding potential: −90 mV; test potential: +60 mV). C and D, mean ± S.E. of Iso-(C, 1 μm, n = 9) and Adr-(D, 10 μm, n = 8) stimulated β1-AR sensor in cells stably or transiently expressing the β1-AR sensor, respectively. Single traces were corrected for bleaching as indicated in B, normalized to the maximal agonist-induced amplitude and smoothed before averaging. The dashed lines indicate the baselines for the evaluation of FRET amplitudes which have been measured in individual experiments. E and F, to quantify the depolarization-induced reduction of FRET response the quotient of amplitudes during activation in depolarization and at holding potential was calculated and subtracted from 1 (100%) to obtain % deactivation. The summarized data at different concentrations of Iso (E, n = 8–10) or Adr (F, n = 5–8) are shown. **: p < 0.001, ***: p < 0.001; one way ANOVA with Bonferroni's Multiple Comparison Test was used as a statistical test.

