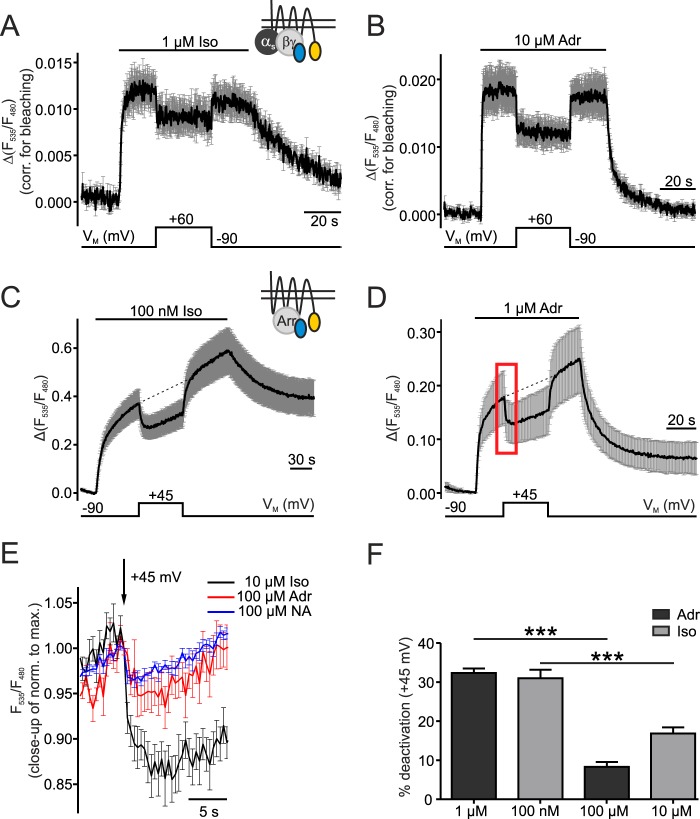
FIGURE 2.
VM alters G protein and arrestin 3 interaction with β1-AR. A and B, interaction of G protein and β1-AR was measured in cells transfected with β1-YFP, CFP-Gγ2 and unlabeled Gαs and Gβ subunits. Cells were stimulated with 1 μm Iso (A, n = 7) or 10 μm Adr (B, n = 7). The measurements were corrected for bleaching before averaging (mean ± S.E.). C and D, arrestin 3 interaction with β1-AR was analyzed in cells expressing β1-YFP, CFP-Arr3 and GRK2 (C: 100 nm Iso, n = 8 and D: 1 μm Adr, n = 6; mean ± S.E.). The membrane potential was depolarized from −90 mV to +45 mV. The red box marks the section of the details in E. Small schematic insets in A and C show the FRET assays corresponding to the figure data. E, an overlay of sections of averaged data (means ± S.E.) with saturating concentrations of Iso (n = 8), Adr (n = 8), and NA (n = 8) shows the depolarization-induced reduction of receptor-arrestin 3 interaction. Individual experiments were normalized to the maximal amplitude before averaging. F, FRET amplitudes to calculate %-deactivation by depolarization during activation with sub- and saturating concentrations of agonist were measured as follows: −90 mV amplitude: baseline to dashed line (C and D), +45 mV amplitude: baseline to curve. Iso (100 nm, n = 8; 10 μm, n = 8) and Adr (1 μm, n = 10; 100 μm, n = 8). The calculation and quantification was performed like in Fig. 1E and F. ***: p < 0.001, one way ANOVA with Bonferroni's Multiple Comparison Test was used as a statistical test.

