FIGURE 6.
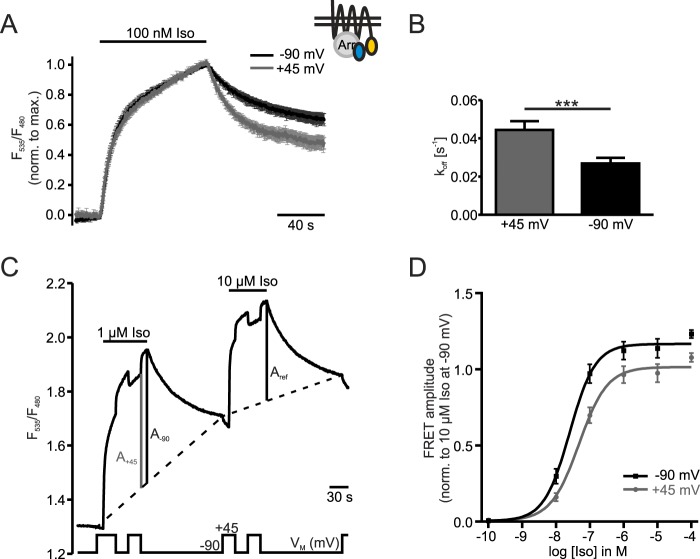
Concentration-response curve yields significant reduction in efficacy by depolarization. The schematic inset shows the FRET-assay detecting interaction between β1-AR-YFP and CFP-Arr3 in the presence of unlabeled GRK2. A, cells were stimulated with 100 nm Iso and measured twice under the constant membrane potentials of −90 mV and +45 mV in an alternating order. Individual experiments were normalized to the maximal amplitudes and averaged (n = 9, mean ± S.E.). B, comparison and statistical analysis of koff-values at constant VM of the data in A. Statistical significance was determined by a paired samples t test, ***: p < 0.001. C, a representative measurement illustrates how data for a concentration-response-curve (D) were collected. Cells were first stimulated with a test concentration of Iso (here 1 μm). After washout of the test concentration the reference concentration of 10 μm Iso was applied. During both stimulations the membrane potential was switched between −90 mV and +45 mV. Amplitudes at +45 mV (A+45) and −90 mV (A-90) of the first stimulation were set in relation to the amplitude at −90 mV during application of 10 μm Iso (Aref). A two-point interpolation (dashed lines) was used to establish baselines for the calculation of the FRET amplitudes. This was necessary to account for the increase in the non-reversible fraction of the FRET signal over the time course of the experiment. D, concentration-response curve was drawn from summarized data collected as described in C at −90 mV and +45 mV at various test concentrations of Iso (n = 3–9 per data point). Paired Student's t-tests confirmed statistically significant differences between data points measured at +45 mV compared with −90 mV at all concentrations of Iso except for 10−10 m Iso.

