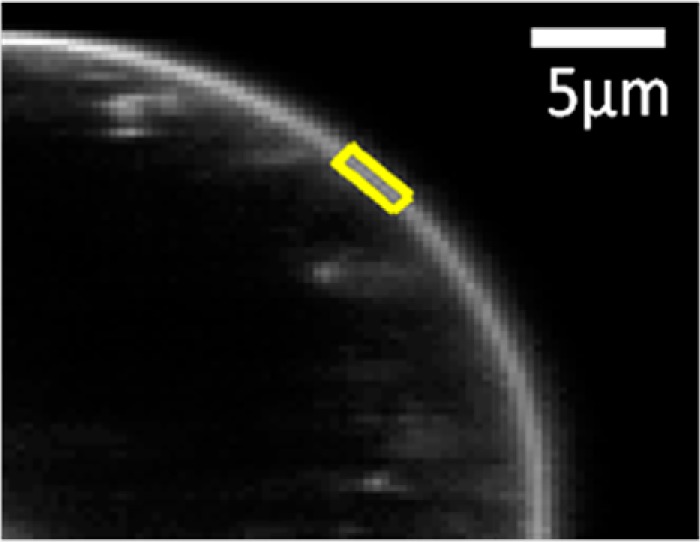
FIGURE 2.

Selection of a membrane region in a cell under reversible osmotic stress. The cell exhibits large areas of stretched membrane with homogeneously distributed EphA2 fluorescence. A region of homogeneous diffraction-limited membrane fluorescence, 3–4 pixels in thickness (indicating stretched membrane) and ∼3 μm in length (yellow), is analyzed to produce one of the data points shown in Fig. 3, A and B.
