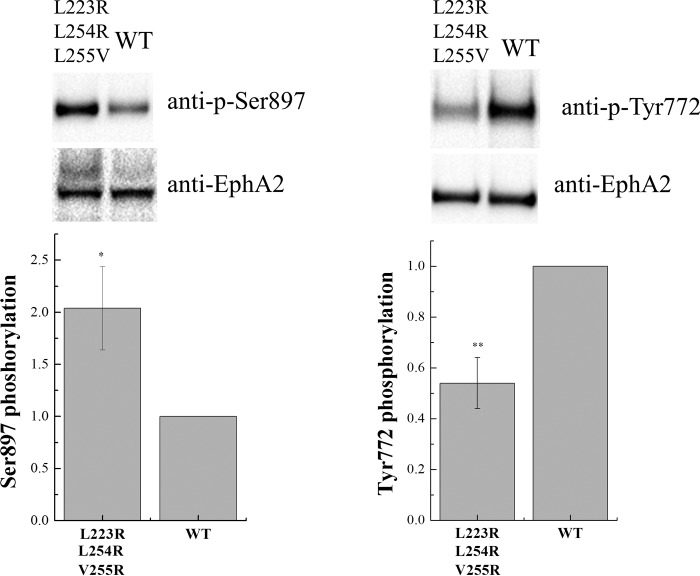
FIGURE 8.
Phosphorylation of wild-type EphA2 and the triple EphA2 mutant. Top, representative Western blot results. Bottom, quantification from three independent experiments. Shown are means and standard errors. The triple mutations led to increased EphA2 Ser-897 phosphorylation and reduced Tyr-772 phosphorylation. *, p < 0.05; **, p < 0.01.

