FIGURE 1.
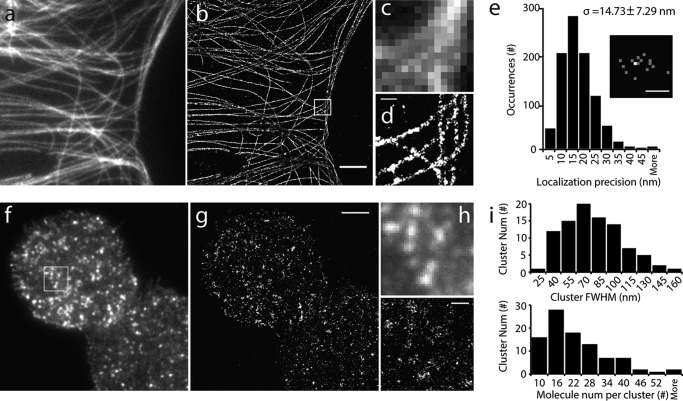
Single-molecule superresolution imaging reveals fine structures of microtubules and syntaxin1A. a, TIRF image of microtubules in a large area of a COS-7 cell. b, superresolution image of the same area by dSTORM. c and d, enlarged views of the TIRF (c) and dSTORM images (d) of the boxed area in b. Note that the pixelation of microtubule structures under TIRF became clearly visible in dSTROM. e, histogram of the point localization precision of centroid positions. The localization uncertainty is determined as (σx + σy) / 2 for each isolated Alexa Fluor 647 molecule, where σx and σy are the standard deviations of the centroid position in x and y dimensions. The localization uncertainty (σ) is 14.73 ± 7.29 nm (n = 1649 molecules). The inset represents the centroid positions of a single Alexa Fluor 647 molecule during 16 photoblinkings, where the brighter spot showed two localizations in the same site. f and g, TIRF (f) and superresolution (g) images of PAmCherry1-labeled syntaxin1A in an INS-1 cell PM sheet. h, enlarged views of the boxed area in f. i, histograms of PAmCherry1-syntaxin1A-EGFP cluster size (top panel; median size, 68 nm in FWHM) and molecule number per cluster (bottom panel; 20.48 ± 6.68/cluster on average). Scale bars = 4 μm (b), 400 nm (d), 40 nm (e), 3 μm (g), and 500 nm (h).

