FIGURE 4.
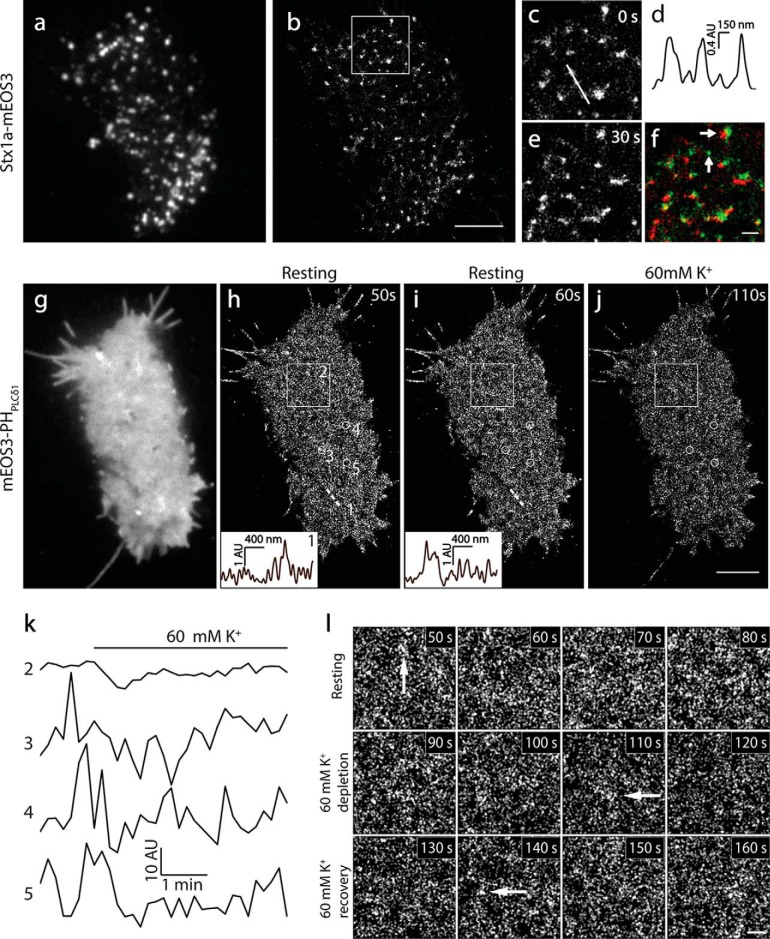
Live-cell PALM imaging revealed homogeneous spatial distribution and fast dynamics of PI(4,5)P2 in INS-1 cells. a and b, TIRF and superresolution images of mEos3.2-labeled syntaxin1A in an INS-1 cell at 35 °C. c–e, enlarged images of the white box regions in b at 0 and 30 s. d, the intensity profile of the syntaxin1A cluster as indicated by the white line in c. e and f, the pseudocolor image of c (green) merged on e (red, f). Arrows indicate the generation, disappearance, and movement of syntaxin1A clusters during 30 s of imaging. g, TIRF image of PI(4,5)P2 in a live INS-1 cell expressed with mEos3.1-PHPLCδ1. The image was acquired rapidly using the green channel before PALM imaging (35 °C). h and i, sequential live-cell PALM images visualized at 10-s intervals. The insets show the intensity profiles of the local PI(4,5)P2 density along the same straight line 1 position indicated at different times. Note the completely different intensity profile changes in 10 s. j, live PALM image of the same cell 30 s after 60 mm K+ stimulation. k, time course of the average intensity of PI(4,5)P2 in the large area (box 2 in h, 3 × 3 μm) and small circles (circle 3, 4, and 5, 500-nm diameter) in h during 5 min of PALM imaging with an interval of 10 s. Note the rapid intensity fluctuations of local PI(4,5)P2 probe changes (circle 3, 4, and 5) compared with very small changes in the relatively broad area (box 2). l, enlarged PALM images of the box 2 region in h at the indicated times. Arrows indicate PI(4,5)P2-enriched membrane patches under physiological conditions. Scale bars = 3 μm (b and j) and 500 nm (f and l).

