FIGURE 6.

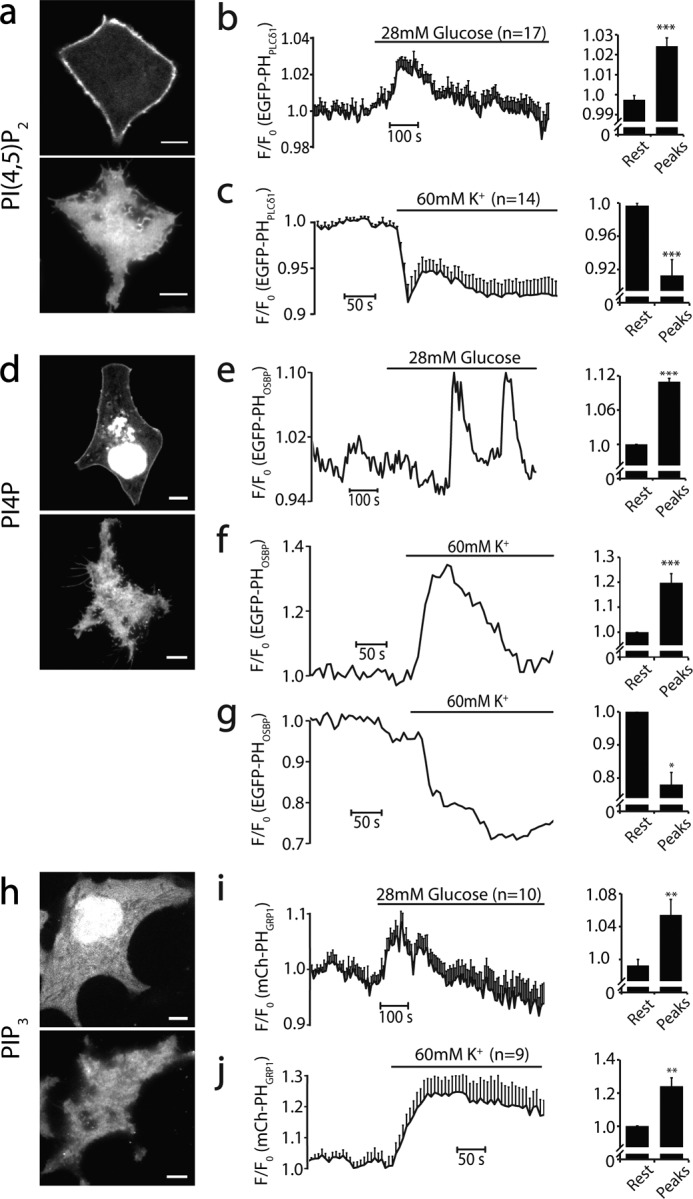
Dynamic changes of phosphoinositides in live cells in response to physiological stimulation at 35 °C. a, confocal (top panel) and TIRF (bottom panel) images of PI(4,5)P2 visualized with EGFP-PHPLCδ1 in INS-1 cells. Note the prominent PM localization of EGFP-PHPLCδ1. b, small but significant increase in EGFP-PHPLCδ1 fluorescence detected by TIRF after 28 mm glucose stimulation (n = 21 cells). c, the same as b but stimulated with 60 mm KCl (n = 14). d, confocal and TIRF images of PI4P visualized by EGFP-PHOSBP on an INS-1 cell. Note the prominent fluorescence in intracellular organelles of the INS-1 cell. e, PI4P oscillations induced by 28 mm glucose in a single INS-1 cell (4 of 24 cells). f and g, diverse PI4P concentration changes after 60 mm KCl stimulation in individual INS-1 cells. The majority of cells showed significant increases in PI4P levels on the PM (f, 24 of 31 cells), but some cells showed decreases (g, 6 of 31 cells), indicating complex PI4P metabolism among different INS-1 cells. h, confocal and TIRF images of mCherry-PHGRP1-labeled PI(3,4,5)P3 on an INS-1 cell PM. i, average responses of PI(3,4,5)P3 after 28 mm glucose (n = 12 cells) and 60 mm KCl stimulation (j, n = 10). For each condition, the baseline and the relative changes of upward/downward peaks were analyzed statistically and compared. *, p < 0.05; **, p < 0.01; ***, p < 0.005. Scale bars = 5 μm.
