FIGURE 2.
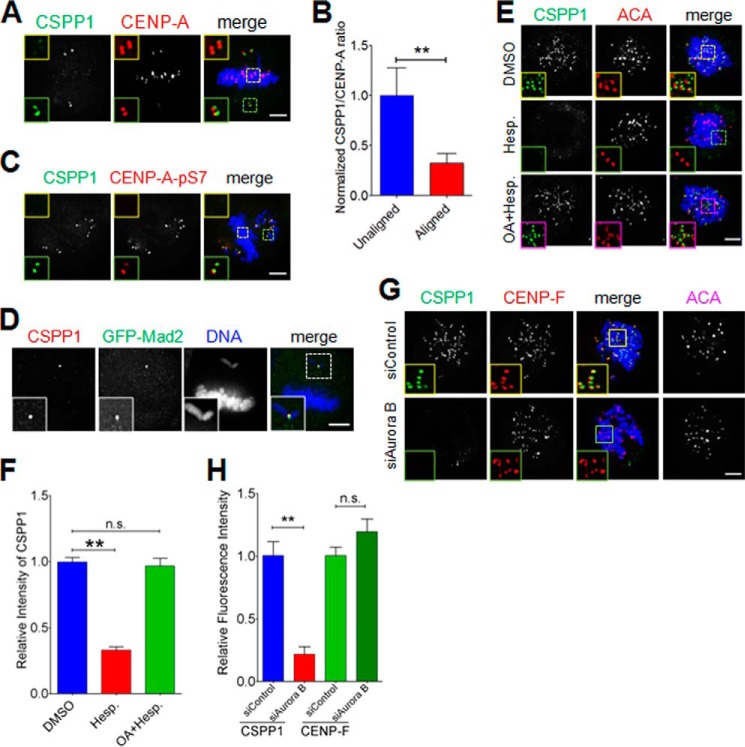
Aurora B kinase activity regulates kinetochore localization of CSPP1. A, CSPP1 preferentially resides on misaligned kinetochores. To induce misaligned chromosomes, single thymidine treatment released HeLa cells were treated with 10 ng/ml nocodazole for 1 h. After methanol fixation, cells were stained for CSPP1 (green), CENP-A (red), and DNA (blue). Scale bar, 5 μm. B, quantitative analysis of CSPP1 kinetochore signal intensity (normalized to CENP-A intensity) as in A. Error bars indicate mean ± S.E. from analysis of more than 40 kinetochores in five cells. Student's t test was used to calculate the p value for comparison of aligned kinetochores and unaligned kinetochores. **, p < 0.001. C, CSPP1 enriched misaligned kinetochores show high Aurora B activity. HeLa cells as described in A were stained for CSPP1 (green), CENP-A-Ser(P)-7 (red), and DNA (blue). Scale bar, 5 μm. D, preferential enrichment of CSPP1 on unaligned kinetochore that is positive for Mad2. HeLa cells expressing GFP-Mad2 were treated as described in A and stained for CSPP1 (red) and DNA (blue). Scale bar, 5 μm. E, Aurora B activity is required for proper localization of CSPP1 on kinetochores. Representative immunofluorescence images of prometaphase cells treated with DMSO (control) or hesperadins for 2 h or first with OA (1 h) followed by OA + hesperadins (Hesp.) (2 h) were fixed by methanol and stained for CSPP1 (green), ACA (red), and DNA (blue). Images are shown in 3-μm projection of z stacks. Scale bar, 5 μm. F, quantitative analysis of CSPP1 kinetochore signal intensity (normalized to ACA intensity) as in E. Error bars indicate mean ± S.E. from analysis of more than 50 kinetochores in five cells. Student's t test was used to calculate p value for comparison of aligned kinetochores and unaligned kinetochores. **, p < 0.0001; n.s., not significant. G, representative immunofluorescence images of prometaphase cells transfected with control or Aurora B siRNA. Before fixation, cells were treated with nocodazole. Then cells were stained for CSPP1 (green), CENP-F (red), DNA (blue), and ACA (shown as grayscale images). The boxed areas are shown magnified. Scale bar, 5 μm. H, quantitative analysis of CSPP1 or CENP-F kinetochore signal intensity (normalized to ACA intensity) as in G. Error bars represent mean ± S.E. from analysis of more than 50 kinetochores in five cells. Student's t test was used to calculate p value for comparison of aligned kinetochores and unaligned kinetochores. **, p < 0.0001; n.s., not significant.

