FIGURE 3.
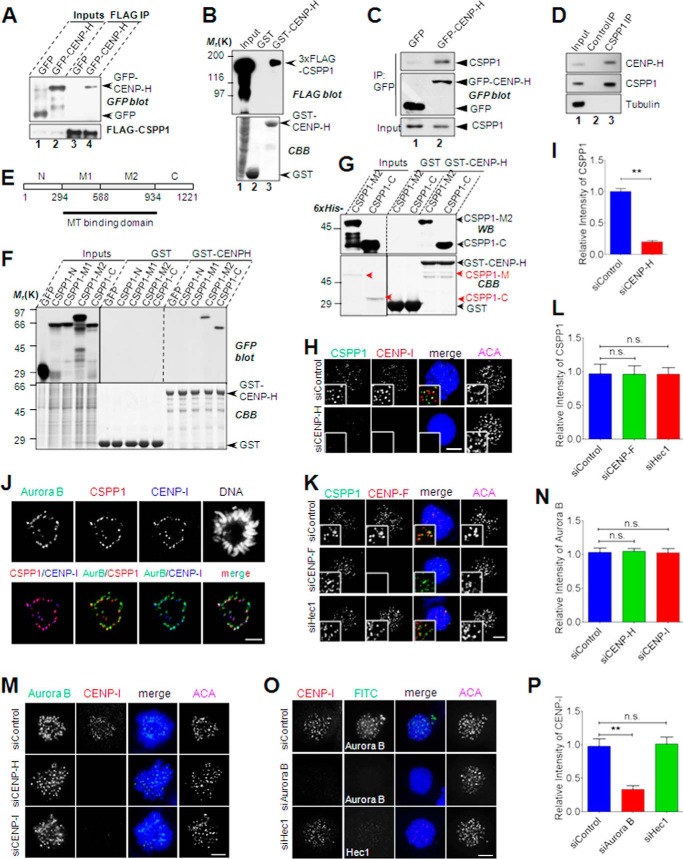
CSPP1 interacts with CENP-H complex. A, CSPP1 interacts with CENP-H in vivo. HEK293T cells cotransfected with 3×FLAG-CSPP1 and GFP or GFP-CENP-H were collected and lysed. The lysates were incubated with anti-FLAG M2 beads. After extensive washes, immunoprecipitations (IP) were probed with anti-FLAG and anti-GFP blots, respectively. Arrows indicate GFP or GFP-CENP-H protein. B, CSPP1 interacts with CENP-H in vitro. GST- and GST-CENP-H-bound glutathione 4B beads were used as affinity matrices to absorb 3×FLAG-CSPP1 expressing cell lysate. Pulldowns were analyzed by SDA-PAGE and probed with anti-FLAG antibody. GST and GST-CENP-H proteins were visualized by Coomassie Blue (CBB) staining. C, CENP-H forms a complex with endogenous CSPP1. Mitotic cells expressing GFP or GFP-CENP-H were lysed and subjected to immunoprecipitation with anti-GFP microbeads. CSPP1 was visualized by anti-CSPP1 antibody. For immunoprecipitation of endogenous CSPP1, mitotic cell lysates were incubated with IgG or CSPP1 antibody followed by extended incubation with protein A/G microbeads. D, endogenous CSPP1 and CENP-H forms a cognate complex. Aliquots of HeLa cells were synchronized by nocodazole treatment followed by incubation of anti-CSPP1 antibody with clarified cell lysate. CSPP1 immunoprecipitates were then fractionated by SDS-PAGE followed by Western blotting analyses of CSPP1, CENP-H, and tubulin. CENP-H was pulled down by an anti-CSPP1 antibody (lane 3) but not control IgG (lane 2). E, schematic showing CSPP1 domains and design for recombinant proteins for mapping CENP-H interactions. F, CSPP1 binds to CENP-H through its C-terminal half. GST- and GST-CENP-H-bound glutathione 4B beads were used as affinity matrices to pull down GFP-tagged CSPP1 deletion mutants as indicated in D. Pulldowns were analyzed by SDA-PAGE and probed with anti-GFP antibody. GST and GST-CENP-H proteins were visualized by Coomassie Blue (CBB) staining. G, direct interaction between CSPP1 and CENP-H. Bacterially expressed and purified CSPP1 deletion mutants were incubated with GST- or GST-CENP-H-bound glutathione 4B beads. After extensive washing, samples were boiled and applied to SDS-PAGE followed by Western blot analyses or Coomassie Blue staining. H, CENP-H complex is required for the kinetochore localization of CSPP1. Representative immunofluorescence images of prometaphase cells transfected with control or CENP-H siRNA. After 2 h of nocodazole treatment, cells were fixed by cold methanol and stained for CSPP1 (green), CENP-I (red), DNA (blue), and ACA (shown as grayscale images). Scale bar, 5 μm. I, quantitative analysis of CSPP1 kinetochore signal intensity (normalized to ACA intensity) as in G. Error bars indicate mean ± S.E. from analysis of more than 50 kinetochores in five cells. Student's t test was used to calculate p value for comparison. **, p < 0.0001. J, spatial localization of CSPP1, CENP-H complex (shown as CENP-I), and Aurora B. HeLa cell expressing GFP-Aurora B was fixed by methanol and subjected to immunostaining for CSPP1 (red), CENP-I (pseudocolor blue), and DAPI. Images were shown for each channel and two-channel merges. Scale bar, 5 μm. K, CENP-F and Hec1 do not contribute to kinetochore localization of CSPP1. HeLa cells transfected with the indicated siRNA were processed as described in H and immunostained for CSPP1 (green), CENP-F (red), DNA (blue), and ACA (shown as grayscale images). Scale bar, 5 μm. L, quantitative analysis of CSPP1 kinetochore signal intensity (normalized to ACA intensity) as in K. Error bars indicate mean ± S.E. from analysis of more than 50 kinetochores in five cells. Student's t test was used to calculate p value for comparison. n.s., not significant. M, depletion of CENP-H complex does not affect kinetochore localization of Aurora B kinase. HeLa cells transfected with indicated siRNA were processed as in H and immunostained for Aurora B kinase (green), CENP-I (red), DNA (blue), and ACA (shown as grayscale images). Scale bar, 5 μm. N, quantitative analysis of Aurora B kinetochore signal intensity (normalized to ACA intensity) as in M. Error bars indicate mean ± S.E. from analysis of more than 50 kinetochores in five cells. Student's t test was used to calculate p value for comparison. n.s., not significant. O, Aurora B kinase also controls kinetochore localization of CENP-H complex. HeLa cells transfected with indicated siRNA were processed as in H followed by immunostaining for CENP-I (red), Aurora B or Hec1 (green, Hec1 knockdown as a negative control), DNA (blue), and ACA. Scale bar, 5 μm. P, quantitative analysis of CENP-I kinetochore signal intensity (normalized to ACA intensity). Error bars indicate mean ± S.E. from analysis of more than 50 kinetochores in five cells. Student's t test was used to calculate p value for comparison. **, p < 0.0001; n.s., not significant.

