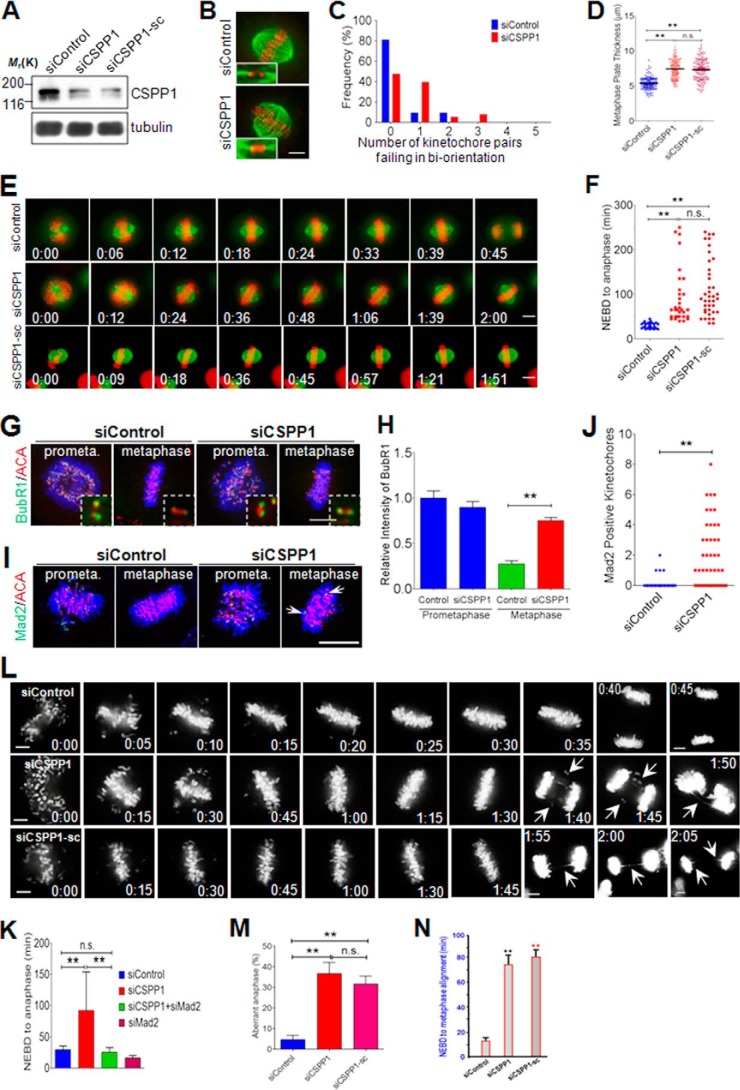
FIGURE 4.
CSPP1 is essential for accurate mitotic progression. A, Western blot shows the efficiency of CSPP1 siRNAs (from Qiagen and Santa Cruz Biotechnology). HeLa cells transfected with control or CSPP1 siRNA were lysed 48 h post-transfection and subjected to Western blots using indicated antibodies. Comparable knockdown efficiency of two independent siRNAs from Qiagen and Santa Cruz Biotechnology, respectively, was shown. B, representative immunofluorescence images (maximal projection) of HeLa cells transfected with control or CSPP1 siRNA for 48 h. To enrich metaphase cells, 8 h after release from thymidine block, cells were treated with MG132 for another 2 h. Afterward, cells were fixed and immunostained for MT (green) and ACA (red). Scale bar, 5 μm. C, CSPP1 depletion does not broadly affect kinetochore-MT attachment. Quantification of the unattached kinetochores in metaphase cells is as treated in B. Histogram shows the percentage of cells with fully aligned kinetochores and cells bearing unattached kinetochore pairs. n = 32 (siControl); n = 38 (siCSPP1). D, CSPP1 knockdown impairs further compaction of metaphase plate during chromosome alignment. Quantitative analysis of metaphase plate thickness of HeLa cells as described in B. **, p < 0.0001 (two-tailed t test). About 150 cells for each group were analyzed. Error bars represent S.E. Note the similar phenotype in the two groups of cells treated with two different sources of siRNA. E, CSPP1 depletion leads to metaphase arrest. Representative real time images show typical mitotic progression in HeLa cells expressing mCherry-H2B and GFP-tubulin. 48 h post-transfection with the indicated siRNAs, images were acquired at the indicated time points. Scale bar, 5 μm. F, quantification of time lapsed from NEBD to anaphase onset for HeLa cells as described in E. **, p < 0.0001 (two-tailed t test); n.s., not significant. n = 32 cells. Note the similar phenotype in the two groups of cells treated with two different sources of siRNA. G, CSPP1 knockdown activated mitotic checkpoint. Representative immunofluorescence images of Hela cells treated with control or CSPP1 siRNA. To enrich prometaphase cells, cells were fixed 8 h post-release from thymidine block; to enrich metaphase cells, after 8 h release from thymidine block, cells were treated with MG132 for an extra 2 h. Cells were fixed and stained for BubR1 (green), ACA (red), and DAPI (blue). Insets are enlarged views of representative kinetochore pairs. Scale bar, 5 μm. H, quantification of BubR1 intensity at the kinetochore (normalized against ACA signals) in cells treated as in G. **, p < 0.0001 (two-tailed t test). n = 100 kinetochores from five cells. Error bars represent S.E. I, representative immunofluorescence images of Mad2 staining in HeLa cells as described in G. In contrast to control metaphase cells, CSPP1-depleted metaphase cells bear Mad2-positive kinetochores (arrows). Scale bar, 5 μm. J, quantitative analysis of Mad2-positive kinetochores in cells as described in I. **, p < 0.0001 (two-tailed t test). n > 50 cells. Error bars represent S.E. K, Mad2 depletion releases mitotic arrest induced by knockdown of CSPP1. Quantification of time for mitotic progression from NEBD to anaphase onset. HeLa cells were treated as described in E. n (siControl) = 32; n (siCSPP1) = 32; n (siCSPP1 + siMad2) = 11; n (siMad2) = 19. **, p < 0.0001 (two-tailed t test); n.s., not significant. Error bars represent S.E. L, live cell images show defect of chromosome segregation for CSPP1-depleted cells. HeLa cells expressing mCherry-H2B were transfected with two different CSPP1 siRNAs for 48 h, separately. 8 h after released from thymidine block, the cells were subjected to live cell imaging. Arrows indicate chromosome bridges or lagging chromosomes. Scale bar, 5 μm. M, statistical analysis of aberrant chromosome segregation among anaphase cells treated with CSPP1 siRNAs, as described in L. Cells that were arrested throughout the whole imaging time without entering into anaphase were excluded from statistics. **, p < 0.0001 (two-tailed t test); n.s., not significant. Three independent imaging experiments are shown. Error bars represent S.E. N, statistical analysis of prometaphase-metaphase delay in CSPP1-depleted cells treated with CSPP1. The prometaphase-metaphase delay was judged by the intervals between NEBD and metaphase alignment in experiment shown in L. Cells that were arrested throughout the whole imaging time without entering into anaphase were excluded from statistics. **, p < 0.0001 (two-tailed t test); n.s., not significant. Three independent imaging experiments are shown. Error bars represent S.E.

