
FIGURE 5.
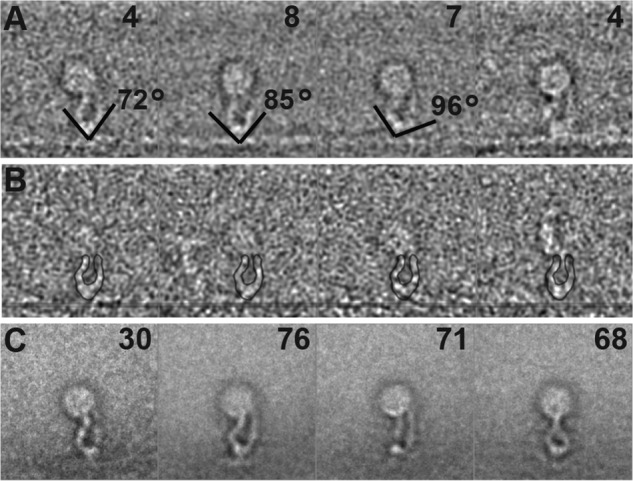
Class-averages of extended αIIbβ3 integrin nanodiscs bound to fibrin. A, montage of four class averages from fibrin-bound integrin nanodiscs from the alignment that excluded the integrin representing 23 of 1,057 images. The number of the members in each class is in the top right corner. The lines show the direction of the adjacent leg densities of the headpiece. The angle between line pairs ranges from 72° to 96°. B, montage of the members in the top left panel class average. The position of the fibrin fiber has been marked for clarity with a translucent line. The outline of the class average is superimposed on the class member for clarity. C, montage of class averages representing 245 of 1,034 integrin nanodisc images from panel A obtained from an alignment on the integrin instead of the fibrin and nanodisc density. The number of class members is noted in the upper right-hand corner of each panel. Note that although all of these integrins are bound to the fibrin, the fibrin orientation with respect to the integrin is highly variable.