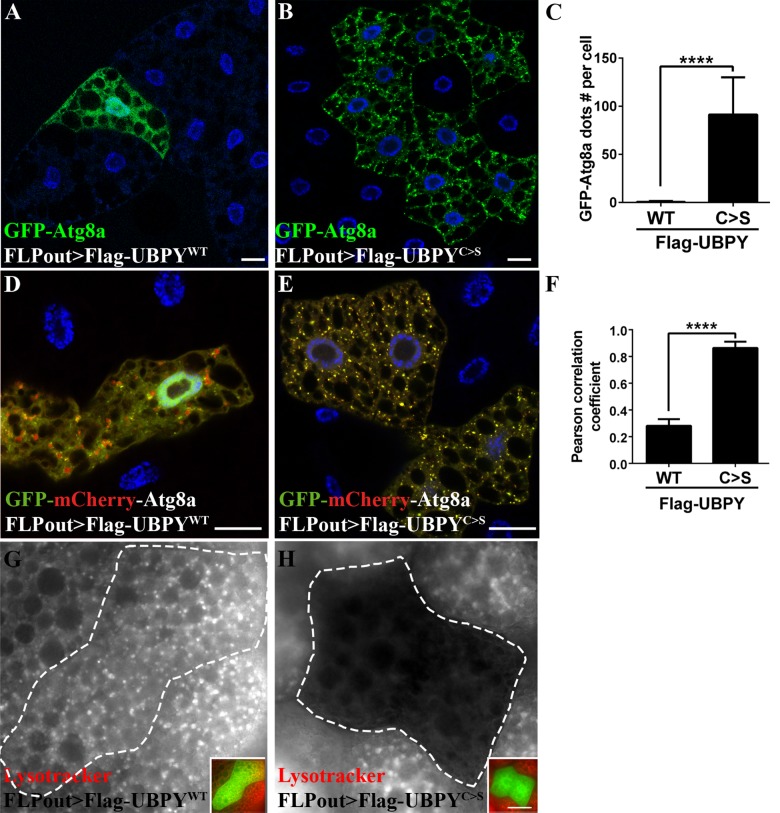
Fig 3. Expression of a catalytic inactive UBPY mutant blocks the autophagy flux.
Expression of the wild-type form of UBPY has no effect on autophagy (Flag-UBPYWT, A) whereas the UBPY catalytic mutant form induces accumulation of GFP-Atg8a dots (Flag-UBPYC>S, B). Quantification of the number of GFP-Atg8a dots per cell is show in C. Confocal sections of larval fat bodies expressing the GFP-mCherry-Atg8a in combination with the wild-type (D) or catalytic inactive (E) forms of UBPY. Please note that the expressing the wild-type form of UBPY (D) were starved to induce autophagy and allow the observation of autophagosomes. (F) Quantification of the colocalization of mCherry and GFP signals using the Pearson’s correlation coefficient. Larvae expressing the wild-type (G) or the mutant (H) form of UBPY were starved to induce autophagy and stained with Lysotracker Red. Insets show the merged channels of the respective images and the clone boundaries are indicated as dotted lines. Scale bars: 20μm. N>6 larvae per experimental condition. For quantification, bars denote mean ± s.d. Statistical significance was determined using one-way ANOVA: ****p<0.0001, ns: not significant. Genotypes: (A, G) y w hs-FLP/+; UAS-GFP-Atg8a/+; Ac>CD2>Gal4/UAS-2xFlag-UBPY WT, (B, H) y w hs-FLP/+; UAS-GFP-Atg8a/+; Ac>CD2>Gal4/ UAS-2xFlag-UBPY C>S, (D) y w hs-FLP/+; UAS-GFP-mCherry-Atg8a/+; Ac>CD2>Gal4/UAS-2xFlag-UBPY WT, (E) y w hs-FLP/+; UAS-GFP-mCherry-Atg8a/+,; Ac>CD2>Gal4/ UAS-2xFlag-UBPY C>S.

