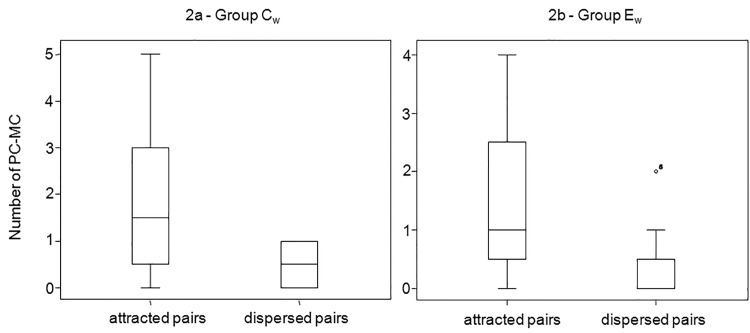
Fig 2. Box plot showing the significant difference (Exact Wilcoxon’s test, p<0.05) between the number of attracted versus dispersed pairs in two wild Lemur catta troops (Cw: May-July 2008, Fig 2a on the left; Ew: March-April 2011, Fig 2b on the right) observed in the Berenty Forest (Madagascar).
Solid horizontal lines indicate medians; the length of the boxes corresponds to inter-quartile range; thin horizontal lines indicate range of observed values.

