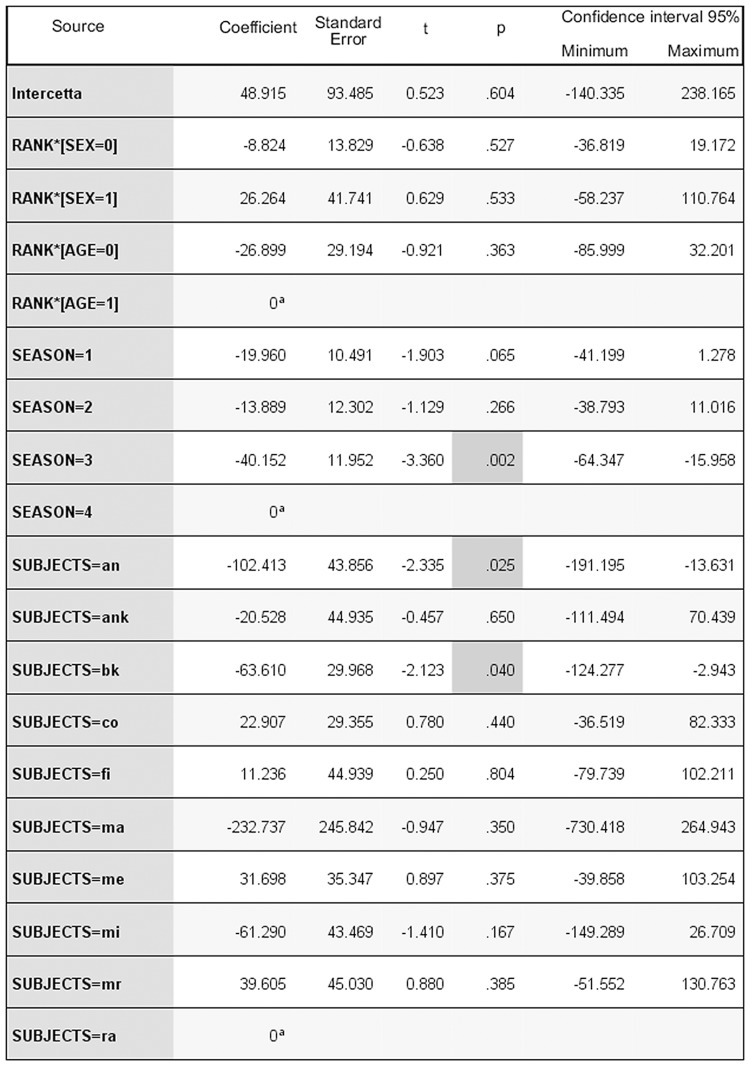
Fig 5. Output of the best model explaining the distribution of Corrected Conciliatory Tendencies (CCT %, scalar target variable) for group Cc.
AICc = 398.767. Season: 1 = lactation; 2 = pre-mating; 3 = mating; 4 = pregnancy. Sex: 0 = male; 1 = female. Age class: 0 = subadult; 1 = adult. aRedundant coefficients.

