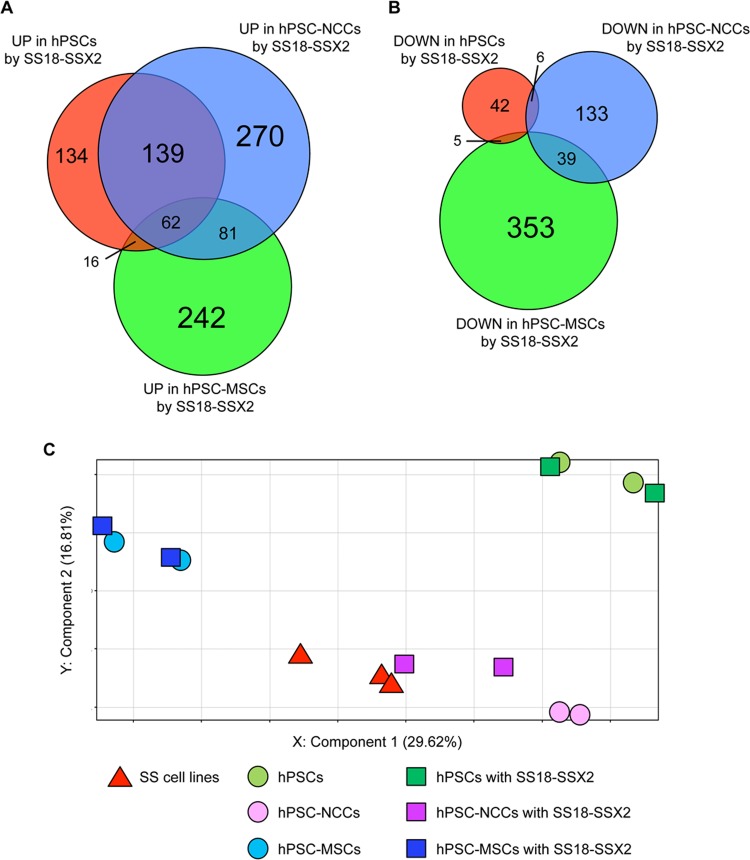
Fig 3. Global gene expression profiles of hPSCs, hPSC-NCCs, and hPSC-MSCs with or without the induction of SS18-SSX2.
A and B) Venn-diagram showing up- (A) and down-regulated (B) genes in hPSCs, hPSC-NCCs, and hPSC-MSCs with the induction of SS18-SSX2. mRNA was extracted from each cell line 24 h after the DOX treatment. Each gene showed a fold change > 2.0 with or without the induction of SS18-SSX2. The numbers of up- and down-regulated genes are shown in the diagram. C) PCA of hPSCs, hPSC-NCCs, and hPSC-MSCs with or without the induction of SS18-SSX2, and SS cell lines. The cell lines and conditions used in this experiment are described in S3 Table. mRNA was extracted from each cell line 12 h after the DOX treatment.

