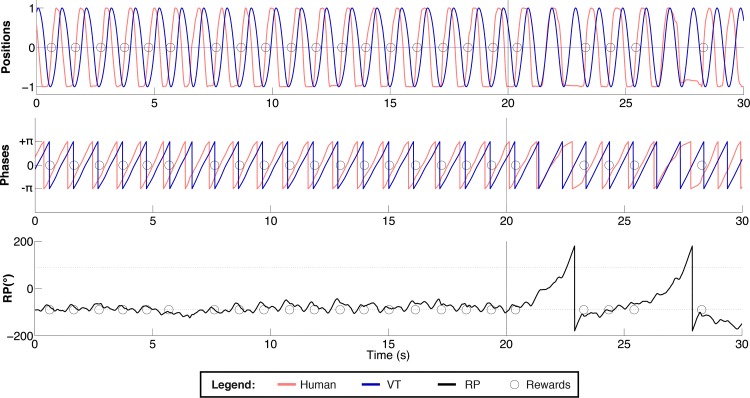
Fig 6. Individual practice trial.
Normalized positions (top panel), phases (middle panel) and RP (bottom panel) are displayed as a function of time. Red lines pertain to human, blue to VT; the gray line depicts the RP specified by the VT (90° or -90°); the circles indicate the moment of feedback delivery. The vertical bar located at 20 s denotes the end of the Exposition and the beginning of the Memory periods.

