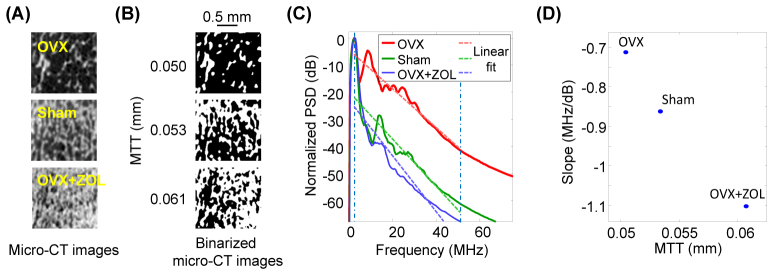
Fig. 2.
(A) Micro-CT images of three rat tibia bones (OVX, Sham, and OVX + ZOL) with different trabecular microstructures, i.e. different mean trabecular thickness (MTTs). (B) Binarized micro-CT images of the three rat tibia bones. Their qualified MTTs were 0.050, 0.053, 0.061 mm respectivly. (C) Normalized power spectral density (PSD) and linear fit (R2 = 0.95, 0.86, 0.85, respectively, for OVX, Sham, and OVX + ZOL) of each bone sample. The leads to quantified spectral parameter slope. (D) The spectral parameter slope quantified from the power spectrum of each bone sample.

