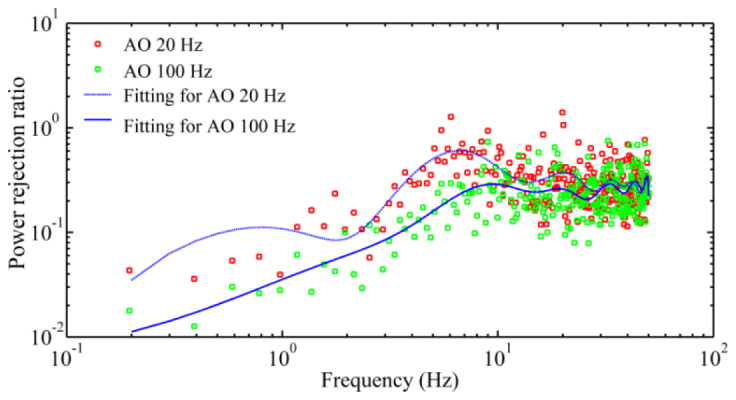
Fig. 10.

Comparison of AO compensation of wavefront aberration with 20Hz and 100 Hz closed-loop frequency. The power rejection ratios (red and green dots) are average values of 5 subjects. The trend lines are least square fitting. For the 20 Hz AO, the wavefront aberration was measured at 100 Hz. DM1 (Hi-Speed DM97-15, ALPAO SAS, France) was used to correct the wave aberration during the image acquisition.
