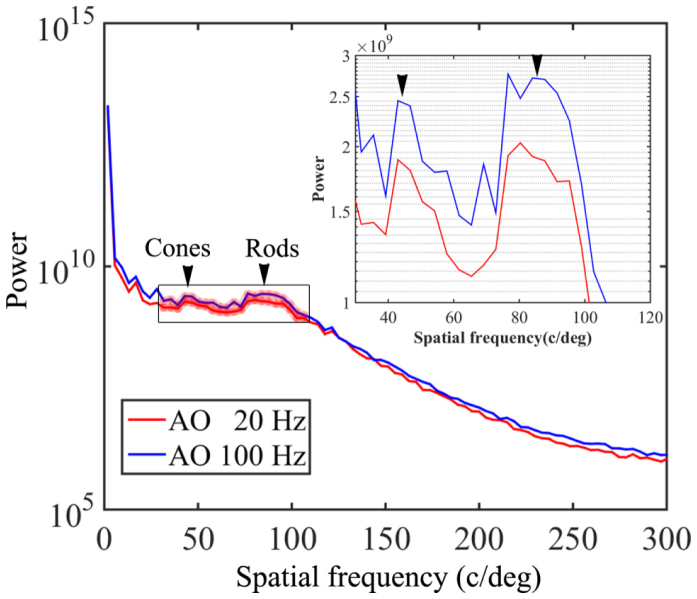
Fig. 12.
Radial power spectra of the retinal images taken with 100 Hz AO and 20 Hz AO correction. Each plot is an average of the radial power spectra of 75 successive retinal images within a 5-second video from one subject. The images were acquired at 4 degrees eccentricity nasally along the primary horizontal retinal meridian. The averaged retina images are shown in Fig. 11. Black arrowheads point to the peaks corresponding to cones (~41 cycles/degree) and rod (~90 cycles/degree). The inset is the magnified spectral region indicated by the box over which the improvement of power spectra by the 100 Hz AO correction is 18-56%. DM1 (Hi-Speed DM97-15, ALPAO SAS, France) was used to correct the wave aberration during the image acquisition.

