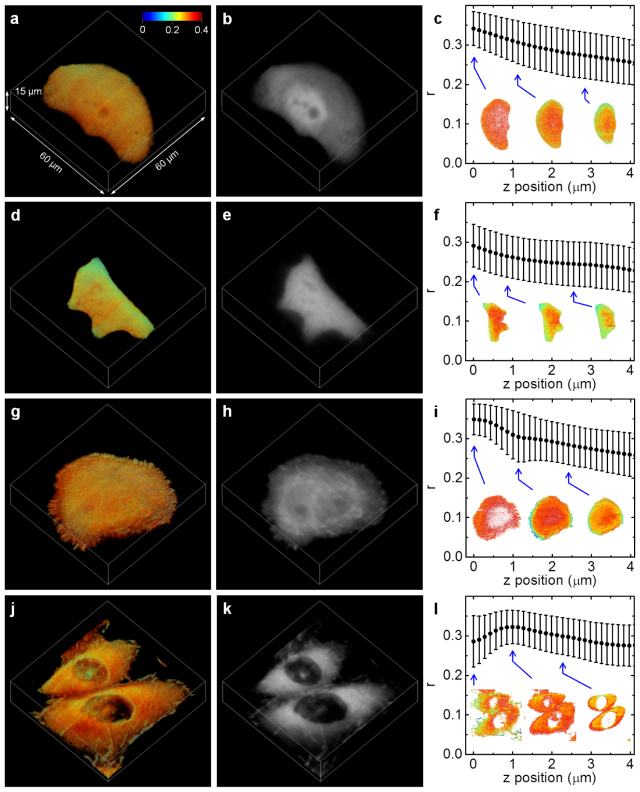
Fig. 4.
Measurements of EGFP expressing CHO-K1 cells (a-c), EGFP-EGFP expressing HeLa cells (d-f), actin-EGFP expressing HeLa cells (g-i), and EGFP-paxillin expressing CHO-K1 cells (j-l). 3D intensity projections of the anisotropy images are shown in the left column. The corresponding 3D intensity projections are displayed in the center column. The right column contains plots of the average anisotropy in each plane of the z stack, the error bars correspond to the pixel standard deviation. Anisotropy images of exemplary planes are shown as insets.

