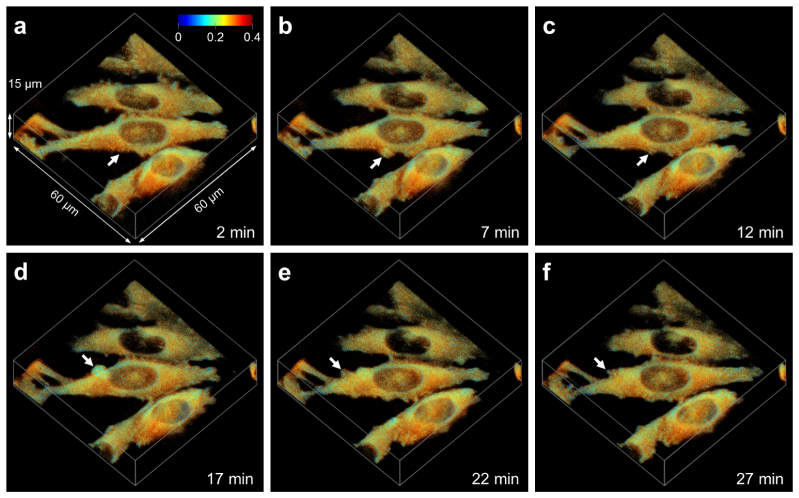
Fig. 5.
Three-dimensional time lapse anisotropy images of EGFP-paxillin expressing CHO-K1 cells (see Visualization 1 (1.4MB, AVI) ). As the cells shown in the 3D intensity projections travel along the surface, membrane protrusions are formed (arrows). At these sites, EGFP-paxillin is compacted forming new adhesions as indicated by the low anisotropy.

