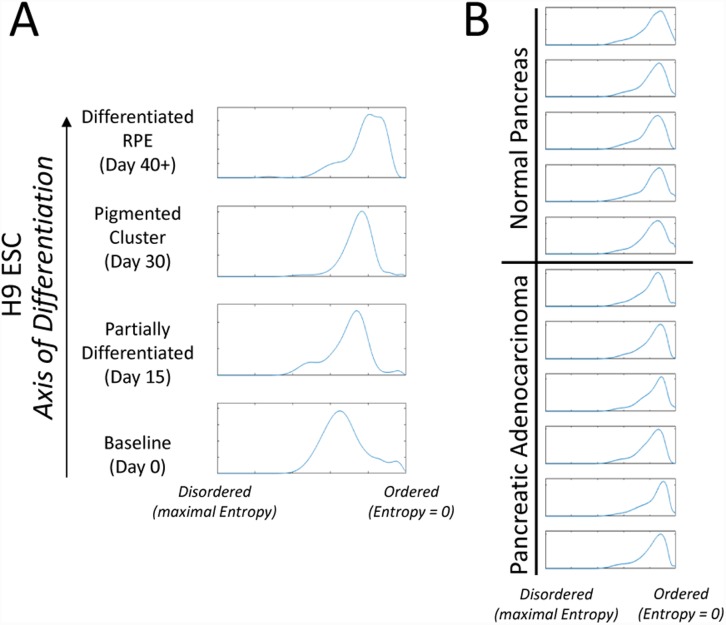
Fig 4. The spectrum of miRNA entropy.
Kernel density estimates of the distribution of normalized miRNA entropy in two sample sets. A) As embryonic stem cells (ESCs) differentiate towards retinal pigment epithelial cells (RPE) the distribution of miRNA entropy is shifted towards more order (Spearman correlation coefficient 0.14, p>0.001). B) No significant difference in the distribution of miRNA entropy with respect to normal pancreas vs pancreatic adenocarcinoma is observed (Kolmogorov-Smirnov test p > 0.05).

