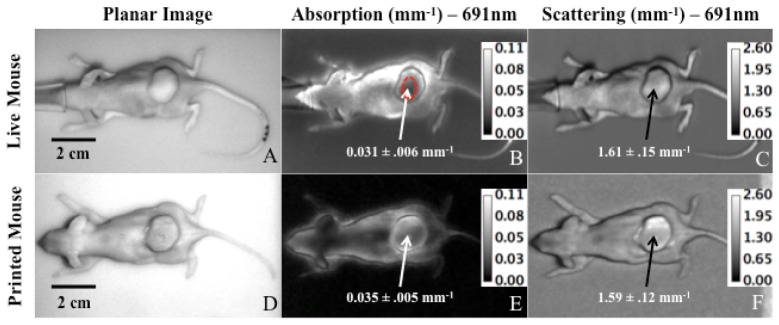
Fig. 5.
Planar images, µa maps, and µs` maps of the live and printed mouse at 691 nm. The red circle in (B.) shows the user defined ROI of 380 pixels (0.31cm2) used to calculate average optical properties of the tumors. An identical ROI was used for 5B-C and 5E-F. The live and custom mice were imaged on different background phantoms.

