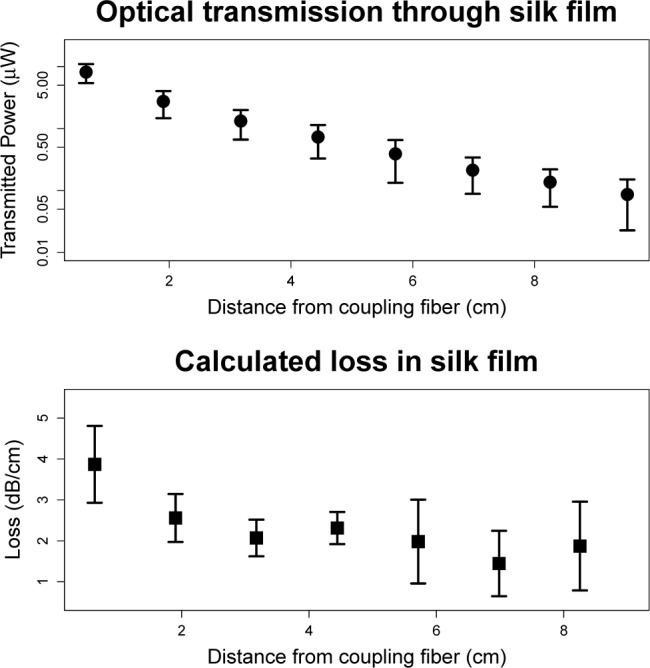
Fig. 2.

Top: Plot showing transmitted power as a function of distance from the coupling fiber. Y-axis is presented on a log scale so the straight line of the data indicates an exponential decline in transmitted power with a consistent decay constant. Error bars indicate 1 standard deviation, n=4. Bottom: Calculated loss per centimeter as a function of distance from the tip of the coupling fiber. High loss near the tip of the coupling fiber is likely due to unguided modes. Error bars indicate 1 standard deviation, n=4.
