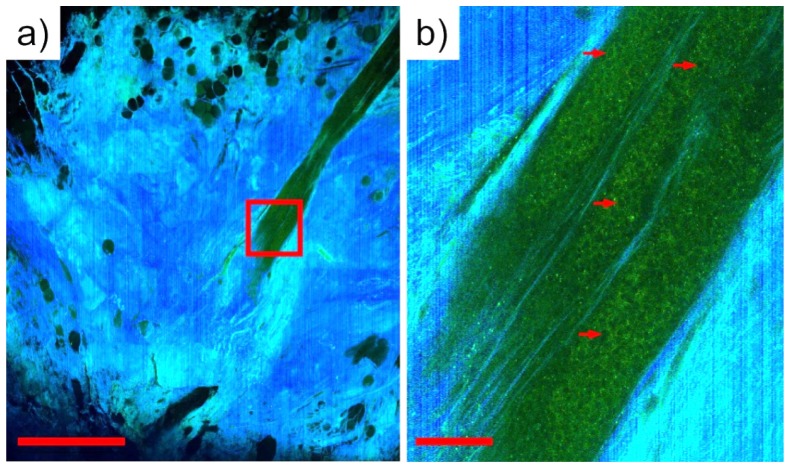
Fig. 4.
a) TPM-FLIM mosaic of the region surrounding a breast duct. Scale bar: 1 mm. b) Enlarged view of the cellular region of a breast duct showing enhanced long lifetime component relative to surrounding stroma. Prominent nuclear shadows can be observed in the ductal region (arrows). Scale bar: 100 microns.

