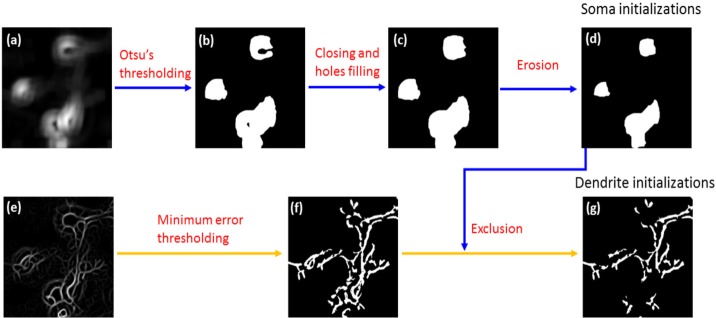
Fig. 7.
Illustration of the initializations for somas and dendrites. The input image to be processed is in Fig. 2 for curve initializations. (a): local standard deviation (b) Otsu’s thresholding results on (a); (c): closing and hole filling on (b); (d): erosion of (c); (e): steerable filtering enhancement for dendrite initializations; (f) The minimum error thresholding results on (e); (g) The final dendrites initialization.

